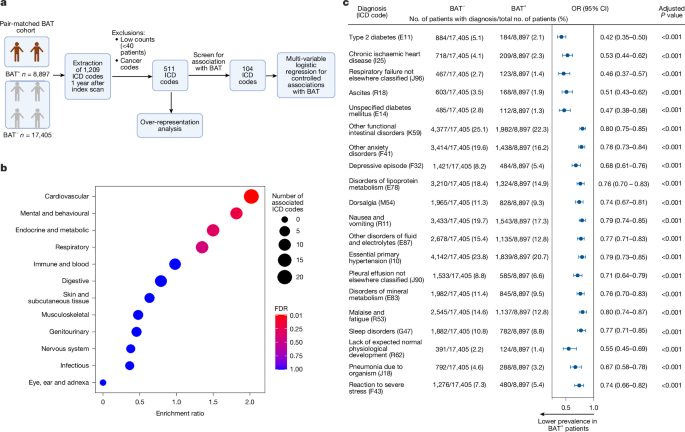
Study design and participantsThis retrospective case–control study followed institutional guidelines and was approved by the Institutional Review Board of Memorial Sloan Kettering Cancer Center (MSK), protocol number 17-581. The requirement for informed consent was waived because the study involved secondary analysis of previously acquired PET–CT imaging and clinical data, posed no more than minimal risk to participants and could not be conducted practically with individual informed consent. All patient data were deidentified before use.We previously established a cohort of patients with BAT by analysing 18F-FDG-PET–CT scans performed at MSK from June 2009 through March 20184. Patients who were positive for BAT in at least one scan were termed BAT+, whereas the remaining patients were grouped as BAT−. To expand this cohort, we established a new Extension BAT Cohort by following a similar strategy. We reviewed all 18F-FDG-PET–CT scans performed at MSK from patients aged 18 years and above from April 2018 through July 2024. People who were positive for BAT on at least one scan were termed BAT+, whereas the remaining patients were grouped as BAT− (Extended Data Fig. 1a and Supplementary Fig. 2). For each patient in both groups, an index scan was designated: in patients with BAT reported on at least one 18F-FDG-PET–CT scan, the first scan that reported BAT was defined as the index scan. In patients without BAT on any scan, the first 18F-FDG-PET–CT scan served as the index scan. We collected demographic, BMI, outside temperature data and pertinent ICD-9 and ICD-10 codes corresponding to cardiometabolic diseases4 (1 year after the index scan) (Supplementary Table 8) from the institutional EHR. Average outdoor temperatures in New York City were obtained from the US National Weather Service. An initial logistic regression analysis was performed on patients in the BAT+ versus BAT− groups who belonged exclusively to the Extension BAT Cohort to establish associations between BAT presence and cardiometabolic diseases. As the association of BAT presence with reduced prevalence of cardiometabolic disease was confirmed in the Extension BAT Cohort (Extended Data Fig. 1b), we proceeded to merge the Established BAT Cohort with the Extension BAT Cohort to create an Expanded BAT Cohort (Extended Data Fig. 1a). If a patient was present in both cohorts, data from the Established BAT Cohort were used.Data collection and PSMTo create a balanced study cohort derived from the Expanded BAT Cohort, patients in the BAT+ and BAT− groups were matched using PSM. Propensity scores were estimated using a non-parsimonious multi-variable logistic regression model with BAT status (presence or absence) as the dependent variable and age, sex, BMI and temperature at time of scan as co-variates. Matching was performed using a greedy nearest neighbour matching algorithm without replacement, with a calliper width set to 0.2 and a matching ratio of 1:2. This resulted in a final study cohort of 26,302 (8,897 BAT+ and 17,405 BAT−). Balance diagnostics were performed to assess the success of the matching procedure using standardized mean differences for all variables included in the propensity score model before and after matching. Postmatching standardized mean differences within the range of −0.10 to 0.10 indicated adequate balance between the BAT+ and BAT− groups across all measured co-variates, supporting the validity of the PSM design for causal inference.We collected pertinent clinical data for each patient as described previously4. In brief, for cancer site, we included the specific cancer diagnostic code (ICD-0) listed closest to the index scan date (Supplementary Table 1). Data referring to cancer treatment were collected if administered within 90 days before the index scan and classified as previously4 (Supplementary Table 2). Pertinent ICD-9 and ICD-10 codes corresponding to cardiometabolic diseases4 (Supplementary Table 8) and all other codes were extracted up to 1 year after the index scan in patients from our PSM cohort. Codes were selected to represent non-paediatric, non-obstetric, adult disorders as explained below.For laboratory values, clinical indices and imaging studies, we extracted available data up to 1 year after the index scan in our PSM cohort. Analyses were performed in BAT+ and BAT− patients with available values. To identify individual pharmacological agents associated with BAT presence, we extracted medications in the home medication list and/or medications with an active pharmacy prescription in the EHR from each patient belonging to our PSM cohort. We included only medications listed up to 1 month before the index scan for each patient. We excluded pharmacological agents with unlikely systemic effects, such as those with topical, ophthalmic, nasal and otic administration. Antimicrobials were excluded as they are generally prescribed in short courses. Medications classified as ‘as needed’ and herbal supplements were excluded. Medications with low frequency counts (present in fewer than 40 patients) were excluded. A final list of medications included in the analyses can be found in Supplementary Table 9. These medications were also grouped by general categories as described in Supplementary Table 9.Selection of diagnostic codes for unbiased associations with BATTo explore unbiased associations between BAT and other diseases, we extracted from the EHR diagnostic codes (ICD-9 and ICD-10) listed up to 1 year after the index scan from patients belonging to our PSM cohort. To select the codes for extraction, we grouped ICD-9 and ICD-10 codes based on their first three letters and/or digits. ICD-10 codes belonging to general groupings: A, B, C, D, E, F, G, H, I, J, K, L, M, N and R were included as they group the medical pathologies most likely to be found in a non-paediatric, non-obstetric, adult cancer population. A similar rationale was used for the selection of ICD-9 codes. A total of 1,157 ICD-10 codes and 626 ICD-9 codes were queried for extraction from the EHR.After code extraction, to avoid redundancy we merged ICD-9 codes with their corresponding ICD-10 codes based on a manual review of each code. The nomenclature of the ICD-10 code was maintained for downstream analysis in cases where an ICD-10 and ICD-9 code were merged. ICD-9 codes that did not have a corresponding ICD-10 code were maintained with their nomenclature. This left us with a total of 1,209 codes between individual ICD-9 and merged ICD-9 and ICD-10 codes.To further filter diagnostic codes for analyses, we excluded codes with low frequencies (present in fewer than 40 patients) and those referring to a cancer diagnosis (Supplementary Table 1) given all patients had a cancer site assigned already. This left us with a final list of 511 diagnostic codes. Given the large number of codes, we initially performed a screening analysis using a univariable logistic regression analysis to identify unadjusted associations of the 511 with the presence of BAT. A total of 104 codes were associated significantly with BAT status in this analysis. Subsequently, we analysed each of these 104 codes using a multi-variable regression analysis to assess their individual association with BAT, while controlling for age, sex, BMI, ambient temperature, self-reported race and ethnicity, smoking history, family history of cardiovascular disease, cancer site, cancer stage, cancer treatment and general groups of outpatient medications (Extended Data Fig. 1a).Machine learning approach to quantify BAT activityThe 3DF workflow19 used PET and CT images in DICOM format. Using information from the DICOM header regarding image orientation and patient spatial positioning, the PET image was resampled to match the dimensions of the CT image through linear interpolation. Both PET and CT images were then converted into the .nrrd file format and processed by nnU-net. The nnU-net model produced a mask prediction where each pixel value corresponds to an anatomical site: 1 for cervical, 2 for supraclavicular, 3 for mediastinal, 4 for paraspinal, 5 for axillary and 6 for abdominal regions. The mask predictions were interpreted by 3DF, and contours were generated. These contours were down-sampled to match the original PET image dimensions, and metrics from the original PET for each anatomical site were exported to an Excel master file. The 3DF process was executed in batch mode, with several instances running simultaneously to efficiently segment a large cohort. We used this method to quantify BAT metabolic activity in 8,709 patients in the BAT+ group from our cohort. A small portion of patients (n = 188) in the BAT+ group could not be quantified due to differences in field of view between the CT and PET image.Machine learning approach to quantify SAT and VAT areaThe 3DF19,60 abdominal adipose tissue workflow was performed on axial CT images at the L3–L4 intervertebral disc level. The target slice was identified automatically using TotalSegmentator61 vertebral segmentation, with the analysis slice defined as the midpoint between the inferior extent of the L3 mask and the superior extent of the L4 mask. The outer body contour on the selected slice was derived by thresholding voxels above −500 Hounsfield units, followed by hole filling, removal of small components, retention of the largest connected component and morphological closing. Outer abdominal circumference was then calculated from the resulting body boundary using DICOM pixel spacing. Adipose tissue was quantified using a hybrid attenuation and AI-based method. Fat voxels were first identified within the body contour using an attenuation range of −195 to −45 Hounsfield units, and these voxels were then partitioned into SAT and VAT using TotalSegmentator tissue-type compartment masks. The outer abdominal circumference (in centimetres), SAT area (in square centimetres), VAT area (in square centimetres) and subcutaneous-to-visceral ratio were exported to an Excel master file. We used this method to quantify WAT distribution parameters in 8,040 patients with BAT from our cohort.Selection of medications for testing in animal and mouse modelsMulti-variable logistic regression analysis revealed that 39 out of 125 individual medications exhibited a significant association with BAT, as depicted in Supplementary Table 6. Of 38 medications examined, 29 had a positive association with the presence of BAT, suggesting that they could act as activators of this tissue. To select candidates for testing, we performed a literature search for each medication focusing on the following criteria: (1) expression of the target receptor and/or pathway in adipocytes, (2) direct effects of the medication in adipocytes and (3) potential cardiometabolic benefits beyond their intended pharmacologic effect. Out of 29 medications, losartan and valsartan fulfilled these criteria.Cellular studies in adipocytesImmortalized and primary brown adipocytes were cultured and differentiated as described previously42, and experiments were performed on mature brown adipocytes on days 7–10 of differentiation. Immortalized cell line tested negative for mycoplasma. Mature brown adipocytes were treated with losartan potassium (Sigma, catalogue no. SML3269) for 24–72 h before experiments. Several doses of losartan (10 μM, 50 μM and 100 μM) were tested initially, and subsequent experiments were done with losartan at a 50-μM dose. NE at a concentration of 10 μM was used to stimulate Ucp1 transcription and activity. For experiments testing losartan metabolites, EXP3174 from Selleckchem (catalogue no. S5980) was used at a dose of 50 μM, and EXP3179 from Cayman (catalogue no. 18855) was used at a dose of 50 μM. For PPARγ inhibition in mature brown adipocytes, GW9662 from Sigma (catalogue no. M6191) was used at a dose of 10 μM. Cells were then collected and processed for downstream RNA and protein analyses. Respirometry on mature adipocytes was performed in 96-well plates per the manufacturer’s instructions (Seahorse, Agilent).As a model for beige and white adipocytes, we isolated the stromal vascular fraction from the inguinal region (enriched in beige adipocyte progenitor cells) and the dorsolumbar region (enriched in white adipocyte progenitor cells) from the inguinal fat depot of 4-week-old mice. Stromal vascular fraction cells from these two regions were plated and differentiated as described previously by our group62,63. Enrichment for adipocytes derived from beige progenitors was confirmed by Ucp1 expression. Cells were then treated with losartan ± NE as described above for brown adipocytes.shRNA-mediated knockdown in brown adipocytesshRNA sequences targeting At1r were obtained from the Broad Institute’s Genetic Perturbation Platform. Oligonucleotides 58 bp in length containing the targeting sequence GCCAGTGTCTTTCTTCTAAAT were cloned in the pLKO.1 vector from Addgene. The pLKO.1-TRC cloning vector was a gift from D. Root (Addgene plasmid, catalogue no. 10878)64. The pLKO.1-shRNAs, pMD2.G and psPAX three-package system were used to construct a silencing-expression lentivirus in HEK293T cells. Cells tested negative for mycoplasma. Primary brown adipocytes were transduced with lentivirus on day 2 of differentiation, and puromycin selection was started at day 4. Cells were used for experiments with losartan once fully differentiated (day 6 and onwards).PPARγ luciferase reporter assayHEK293T cells were transfected using Fugene HD (Promega) with plasmids containing PPARγ2 (pBabe bleo human PPARγ2), RXRa (pSV Sport RXRa), PPRE (DR1X3) firefly luciferase reporter (PPRE X3-TK-luc) and renilla luciferase (pRL-TK-Renilla, Promega). PPRE X3-TK-luc (Addgene plasmid, catalogue no. 1015) and pSV Sport RXRa (Addgene plasmid, catalogue no. 8882) were a kind gift from B. Spiegelman65,66. pBabe bleo human PPARγ2 (Addgene plasmid, catalogue no. 11439) was a kind gift from C. R. Kahn. Following an overnight transfection, cells were treated with cells with increasing concentrations of losartan, EXP3179, EXP3174 and rosiglitazone as a positive control. Cells were lysed and processed for luciferase assays according to the Dual-Luciferase Reporter Assay System (Promega) protocol.Animal studies and metabolic phenotypingAll animals in this study were male mice on a C57BL/6J background and maintained on a 12-h light–dark cycle with free access to food and water. All mice were housed at 23 °C and fed with a standard rodent chow diet. Animal care and experimentation were performed according to procedures approved by the Institutional Animal Care and Use Committees at the Rockefeller University (24019-H) and Weill Cornell Medicine (2017-0043).For animal studies using losartan, 10- to 14-week-old C57BL/6J wild-type mice were treated with 100 mg kg−1 d−1 losartan by oral gavage twice a day, or losartan dissolved in their drinking water at the same dose. Water intake per mouse was monitored every 48 h to 72 h to warrant the above dose was maintained throughout the experiments. Mice were randomized to treatment, and investigators were not blinded. Sample size was determined based on preliminary experiments. Mice were then euthanized and BAT was collected for protein and RNA analyses.For assessment of BAT-specific heat production, we used forward-looking infrared (FLIR) thermography using a Teledyne FLIR E96 infrared camera with emissivity set to 0.98. C57BL/6J wild-type mice were treated with 100 mg kg−1 d−1 losartan dissolved in their drinking water for 1 week at room temperature, after which mice were acclimated to thermoneutrality (28 °C) for 1 week before image acquisition. Mice were anaesthetized under isoflurane gas 4 days before experiments, at which point we shaved a 2 × 2-cm region in the midline interscapular and midline lumbar regions. We briefly applied Nair hair removal cream to the shaved regions to ensure lasting skin exposure. Mice were monitored during and after anaesthesia and shaving to ensure full recovery and minimal irritation. After 1 week at thermoneutrality, mice were injected with 1 mg kg−1 of CL-316243 and 2 h later thermal images were captured by gently suspending non-anaesthetized mice by the tail. Duplicate images for each mouse were analysed using FLIR Thermal Studio software. We considered the average maximum temperature recorded in each shaved region as indicators of interscapular and lumbar temperature. The absolute temperature difference between interscapular and lumbar temperature was used to quantify BAT thermogenesis, as reported previously by other researchers67,68,69,70.Whole-body metabolic measurements were performed using a Promethion Metabolic Screening System for Mice (Sable Systems International). Mice were housed individually with ad libitum access to standard chow diet and given either drinking or losartan water under a 12-h light–dark cycle. Before experimentation, mice were housed singly and acclimatized to room temperature (22 °C) for 10 days within temperature-controlled environmental enclosures (DB034 Laboratory Incubator, Darwin Chambers). For the cold exposure challenge, mice were transferred to a 4 °C environmental chamber and maintained in metabolic cages with a consistent volume of pine chip bedding, without cotton nesting squares for a 5-day experiment. Losartan was administered in drinking water at the indicated concentration throughout the study period, and water intake was monitored continuously. Rates of oxygen consumption and carbon dioxide production were acquired by indirect calorimetry with a sampling frequency of 1 s. Respirometry values were determined every 5 min; the dwell time for each cage was 30 s, with baseline cage sampling frequency of 30 s occurring every four cages71. Data were processed further as hourly values and cumulative measurements over 24-h periods, including separate analyses for light and dark phases.Energy expenditure was assessed using indirect calorimetry and calculated using the Weir equation72. Distance travelled (activity) is determined by x and y position displacements represented by beam breaks within a grid of infrared sensors built into each cage (PedMeters and AllMeters). Food and water intake were recorded automatically. Body weight was measured before, before 4°C exposure and at the end of the study. Animals were monitored daily to ensure health and stability during cold exposure. Raw data were subjected to chamber-level quality control before to analysis. Fat and lean mass were determined using EchoMRI analysis.Data acquisition and instrument control were coordinated by IM-3 software, and the resulting raw data were processed with Macro Interpreter v.2.38 (Sable Systems) using an analysis script detailing all aspects of data transformation (One-click macro v.2.45; Sable Systems). Indirect calorimetric data were analysed using Excel, R and validated using CalR and graphed using GraphPad Prism v.11.RNA isolation, cDNA synthesis and real-time PCRFor RNA extraction from cultured mature adipocytes, cells were lysed in RLT buffer (Qiagen) and RNA was extracted using RNeasy Micro and Mini kits (Qiagen). cDNA was synthesized through reverse transcription using a cDNA synthesis kit (Applied Biosciences). cDNA was analysed by real-time PCR using specific gene primers and a SYBR Green Master Mix (Life Technologies). Relative fold changes of mRNA levels were calculated using the ΔCT method with cyclophilin as loading control. A list of primer sequences can be found in Supplementary Table 10.Protein extraction and western blotFor protein extraction from cultured adipocytes and tissue from mice, cells and/or tissue were lysed in radioimmunoprecipitation assay buffer with protease inhibitor cocktail and phosphatase inhibitor cocktail. Protein extracts were resolved on pre-cast polyacrylamide gels (BioRad, 4–20% Mini PROTEAN) and transferred to a polyvinylidene fluoride membrane. Membranes were incubated overnight at 4 °C with appropriate primary antibodies. Detection of proteins was carried out by incubation with horseradish peroxidase-conjugated secondary antibodies followed by enhanced chemiluminescence detection reagents. Band density was quantified using Fiji/ImageJ (National Institutes of Health (NIH)).Statistical analysisThe association between BAT and age, BMI and temperature was assessed by a Pearson’s correlation coefficient. Prevalence of BAT in men and women was compared using a chi-squared test.To assess whether BAT status was a predictor of cardiometabolic diseases in the PSM cohort, we used multi-variable logistic regression adjusting for age, sex, BMI, ambient temperature, self-reported race and ethnicity, smoking history, family history of cardiovascular disease, cancer site, cancer stage, cancer treatment and general groups of outpatient medications. BAT metabolic activity (total and depot-specific) was calculated as the product of SUV mean and BAT volume (in millilitres) and stratified into tertiles. The association of BAT activity with cardiometabolic diseases was assessed using a multi-variable logistic regression adjusted for age, sex, BMI and outdoor temperature with patients in the BAT− group or those in tertile 1 (lowest BAT metabolic activity) as reference. The correlation of BAT activity with age and outside temperature was calculated with Pearson correlation coefficient after logarithmic transformation. The association of BAT activity with SAT area, VAT area, SAT to VAT ratio and other continuous clinical variables was calculated with linear regression after logarithmic transformation.The association of BAT status and an expanded set of 511 ICD codes was assessed by univariable logistic regression to identify crude associations. ICD codes associated significantly with BAT were then analysed individually through multi-variable logistic regression analysis adjusting for age, sex, BMI, ambient temperature, self-reported race and ethnicity, smoking history, family history of cardiovascular disease, cancer site, cancer stage, cancer treatment and general groups of outpatient medications. For over-representation analysis, the 511 codes were grouped by organ system. Enrichment for each organ system category was calculated based on the proportion of BAT-associated ICD codes divided by the corresponding proportion among all diagnostic codes in the category set. Statistical significance of over-representation was assessed using Fisher’s exact test and Benjamini–Hochberg FDR was used for multiple test adjustments.Unpaired t-tests were used to compare laboratory values, imaging studies and clinical indices in patients in the BAT+ versus BAT− groups. Variance equality was assessed with an F-test. When variances were equal, standard t-tests assuming equal variances were used; otherwise, t-tests with unequal variance adjustments were applied. For adjusted analyses, GLMs were used to estimate least square means, adjusting for age, sex, BMI, self-reported race and ethnicity, ambient temperature, cancer site, cancer stage and cancer treatment. Post hoc pairwise comparisons were performed using Tukey’s HSD method. Categorical variables were compared using Fisher’s exact test.Associations between BAT and individual medications were assessed through multi-variable logistic regression adjusted for age, sex, BMI, temperature, ethnicity, race, smoking history, family history of cardiovascular disease, cancer sites, cancer stage, cancer treatment and cardiovascular diagnoses. For in vitro and in vivo proof-of-concept experiments, group comparisons were conducted using unpaired t-tests. To account for multiple comparisons, P values were corrected using the Benjamini–Hochberg FDR method, and adjusted P values are reported as such where applicable. Metabolic cage data were analysed, and statistical significance was calculated either using two-way analysis of variance for hourly data or unpaired t-test for 24-h cumulative, light and dark cycle. All analyses were performed using SAS (v.9.4), R software (v.4.5.1) and GraphPad Prism (v.10.5.0). All reported P values are two-sided and statistical significance was defined as α Reporting summaryFurther information on research design is available in the Nature Portfolio Reporting Summary linked to this article.