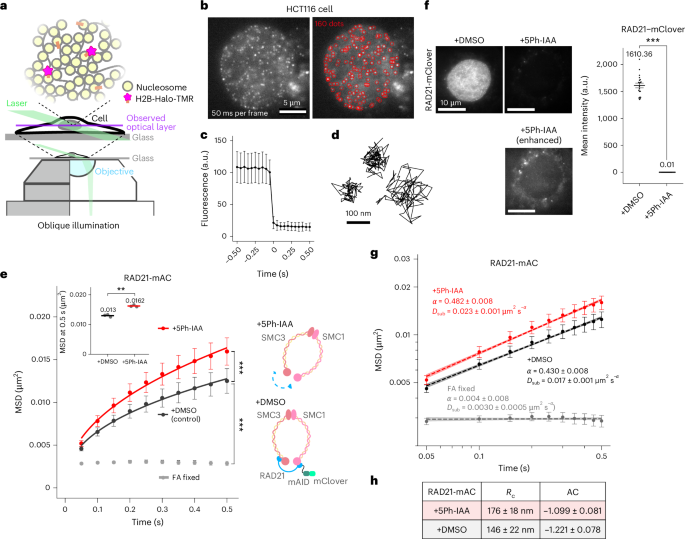
All experiments complied with relevant ethical regulations. This study used established human cell lines and involved no human participants, human samples or animals; therefore, no human or animal ethics approval was required. Recombinant DNA experiments were approved by the Institutional Recombinant DNA Experiment Safety Committee of the National Institute of Genetics (R7-7). Additional experimental details are provided in Supplementary Methods.Cell lines and culture conditionsHeLa S3 cells108 and HT1080 cells with lacO/EGFP-LacI and tetO/TetR-4×mCherry (a clone of TT75, TT165, kindly provided by T. Tanaka, University of Dundee)62 were cultured at 37 °C in 5% CO2 in DMEM (D5796-500ML, Sigma-Aldrich) supplemented with 10% FBS (FB-1061/500, Biosera). All HCT116 cells (CCL-247, ATCC) with AID2 for rapid depletion55 were cultured at 37 °C in 5% CO2 in McCoy’s 5 A medium (SH30200.01, HyClone) supplemented with 10% FBS.Target protein depletion by AID2To rapidly degrade RAD21-mAC, CTCF-mAC and WAPL-mAC, HCT116 cells expressing OsTIR1(F74G) were treated with 1 µM 5Ph-IAA for 1 h (RAD21), 2 h (CTCF) or 4 h (WAPL), respectively, except where noted otherwise55,67. Control cells were treated with 0.1% dimethyl sulfoxide (D2650-5X5ML, Sigma-Aldrich). Degradation of the target proteins was confirmed by the loss of mClover fluorescence. After treatment, cells were fixed, permeabilized and stained with DAPI as described in the Supplementary Methods—‘Expression and localization of H2B-HaloTag or H3.3-HaloTag’. Z-stack images (30 sections at 0.2 µm intervals along the z axis) were acquired using a DeltaVision Ultra microscope (Applied Precision) equipped with an Olympus PlanApoN ×60 objective lens (NA 1.42). Nuclear mClover fluorescence intensity was quantified using Fiji, with background signal subtracted.RAD21-mAC, WAPL-mAC or CTCF-mAC degradation was also confirmed by western blotting. The procedure was the same as described in the Supplementary Methods—‘Expression and localization of H2B-HaloTag or H3.3-HaloTag’. Membranes were probed with mouse anti-RAD21 (1:1,000; 05-908, Upstate), rabbit anti-WAPL (1:1,000; A301-779A-T), rabbit anti-CTCF (1:1,000; 10915-1-AP, PGI Proteintech) and mouse anti-mAID (1:1,000; M214-3, MBL) antibodies, followed by horseradish peroxidase-conjugated goat antimouse secondary antibody (1:5,000; 170-6516, Bio-Rad), or antirabbit IgG DyLight 800 (1:5,000; SA5-35571, Invitrogen). As a loading control, a goat anti-GAPDH antibody (1:2,500; 12004158, Bio-Rad; StarBright Blue700 conjugated) was used.Single-nucleosome imagingEstablished cell lines were cultured on poly-L-lysine-coated glass-based dishes (3970-035, Iwaki). H2B-Halo or H3.3-Halo incorporated into nucleosomes was fluorescently labeled with 80 pM HaloTag TMR ligand for 20 min at 37 °C in 5% CO2, washed thrice with 1× HBSS (H1387, Sigma-Aldrich) and then incubated in the following media overnight before single-nucleosome imaging. HeLa S3 cells were observed in DMEM (21063-029, Thermo Fisher Scientific), and HCT116 cells in McCoy’s 5 A (1-18F23-1, BioConcept). These media were phenol red (PR) free and supplemented with 10% FBS. To increase the number of tracked nucleosomes when applying the RL algorithm for motion classification, H2B-Halo was labeled with 50 nM PA-JF646 (provided by the Lavis Lab, Janelia Research Campus)75 overnight using the same labeling procedure.A live-cell chamber (INU-TIZ-F1, Tokai Hit) and digital gas mixer (GM-8000, Tokai Hit) were used to maintain cell culture conditions (37 °C, 5% CO2 and humidity) during microscopy. Single nucleosomes were observed using an inverted Nikon Eclipse Ti microscope equipped with a 100-mW Sapphire 561-nm laser (Coherent) and an sCMOS ORCA-Flash 4.0 or ORCA-Fusion BT camera (Hamamatsu Photonics). Live cells labeled with TMR were excited with the 561-nm laser through an objective lens (×100 PlanApo TIRF, NA 1.49; Nikon) and detected at 575–710 nm. An oblique illumination system with a TIRF unit (Nikon) was used to excite fluorescent nucleosome molecules within a thin area of the cell nucleus and reduce background noise (Fig. 1a). Sequential image frames were acquired using NIS-Elements (Nikon) at a frame rate of 50 ms under continuous illumination. Please note that freely diffusing, non-nucleosomal histones cannot be tracked at this frame rate. For PA-JF646-labeled nucleosome tracking, the cells were continuously photoactivated with weak 405-nm illumination (1.0 mW, 25% AOTF attenuation) together with 640-nm laser excitation.To visualize the basal nuclear surface (nuclear periphery), we adjusted the angle of laser illumination to efficiently capture a nuclear membrane marker, NUP107-Venus109. Almost uniform distributions of NUP107-Venus were observed in the nuclear periphery condition, while the nuclear interior condition showed a rim of NUP107-Venus76. As reported previously76,77, nucleosome dynamics on the nuclear surface were lower than those of the nuclear interior, which contained more euchromatin regions. Position-determination accuracy is 7.3 nm (Extended Data Fig. 7g).Single-nucleosome tracking analysisTo study nucleosome motion within chromatin domains accurately, we mainly focused on the 0–0.5 s time window, which corresponds to the spatial range of typical chromatin domain sizes (up to ~300 nm). At longer time scales, other factors, such as higher-order structures (for example, compartments, territories) and nuclear movements, become more influential (for details, see refs. 45,110). To obtain the Rc value57, we also analyzed longer-time data, up to ~3 s.Image processing, single-nucleosome tracking and single-nucleosome movement analysis were performed as previously described5,41,45,76. Briefly, sequential images were converted to 16-bit grayscale, and background noise was subtracted using the rolling-ball background subtraction (radius, 50 pixels) in ImageJ. Nuclear regions in the images were manually extracted. The fluorescence dots were fitted with a 2D Gaussian function80,111 and tracked using u-track software112, or their centers were determined by LoG detector in Fiji plugin TrackMate113.To assess positional accuracy, we calculated the s.d. of the 2D movement of immobilized nucleosomes per 50 ms in FA-fixed cells (n = 10 nucleosomes). We found that 12.5 nm (the mean of SDx and SDy) was the localization accuracy (Extended Data Fig. 1d). Single-step photobleaching profile confirmed that the individual dots represent single nucleosomes (Fig. 1c).For single-nucleosome imaging/tracking, we calculated displacement and MSD of nucleosomes, because MSD captures the relevant constrained nucleosome dynamics, for the following reasons: the vast majority of the labeled histones are incorporated into nucleosomes constrained along a very long polymer rather than freely diffusing, and state mixing is minimal. In this respect, single-nucleosome imaging is very different from single-molecule tracking of transcription factors. MSD in single-molecule tracking of transcription factors can be error prone because multiple diffusion states (free 3D diffusion, one-dimensional sliding, specific binding) interconvert, and displacement-based analyses are often preferable (for example, ref. 114).For single-nucleosome movement analysis, the displacement and MSD of the fluorescence dots were calculated based on their trajectory using a Python script. In our tracking, trajectories of single-nucleosome dots on the XY plane \({\left({{x}}_{i}\right)}_{i=0}^{n}\) were acquired, where xi indicates XY coordinates at the time point i. Then, we calculated the MSD for the lag time ∆ by:$${\mathrm{MSD}}\left({\mathrm{lag}}\,{\mathrm{time}}\right)=\frac{1}{n-\Delta}\sum _{i=1}^{n-\Delta}{\left|{x}_{i}-{x}_{i+\Delta}\right|}^{2}$$
(1)
The originally calculated MSD was in 2D. To obtain the 3D value, the 2D value was multiplied by 1.5 (4 to 6 D × t). The calculated MSDs were fitted to a subdiffusive model MSD