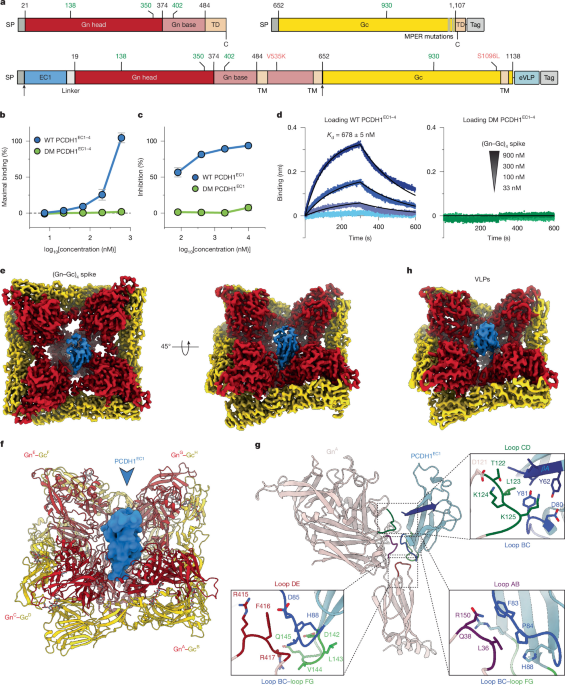
Protein purificationSoluble spike proteinsTo produce the soluble spikes of ANDV, we inserted synthetic genes for Gn and Gc of ANDV (strain Chile-9717869, UniProt: Q9E006) codon-optimized for expression in Drosophila cells into a bicistronic plasmid to produce the plasmid p-sSpike. We designed the hetero-octamerization domain starting from HALC4_136, a synthetic homo-tetramerization domain formed by three antiparallel helices, which has the appropriate dimensions (PDB: 8D09)20. In the first cistron of the plasmid, we cloned the ectodomain of Gn (amino acids 21–483) followed by the first two helices of HALC4_136, which we refer to as HALC4_136N. The second cistron contains the complete ectodomain of Gc (amino acids 652–1107) followed by the third α-helix of HALC4_136, named HALC4_136C. To avoid aggregation, we introduced four mutations in Gc: F1089A, F1093A, L1100A and L1104A. To further stabilize the hetero-oligomerization domain, we designed a disulfide bond joining the C terminus of HALC4_136N with the N terminus of HALC4_136C. For purification purposes, we introduced a double strep-tag at the C terminus of HALC4_136C. For the structural studies, we cloned the extracellular cadherin domains EC1–4 of human PCDH1 (amino acids 58–503, UniProt: Q08174) into a pMT/BiP plasmid in frame with a His and a double-strep tag to produce the plasmid p-sEC1–4. We used these plasmids to obtain stable transfectants of Drosophila S2 cells (Thermo Fisher Scientific, R69007, authenticated by Thermo Fisher Scientific by karyotyping and isozyme profiling), together with the pCoPuro plasmid (ratio 1:20) for puromycin selection46. We generated stable cell lines with the p-sSpike (soluble spike) plasmid alone and cell lines co-transfecting p-sSpike and p-sEC1–4 (EC1–4). Stable cell lines were selected and maintained in LM-SFM4 medium (Cytiva) containing 8 μg ml−1 puromycin. Cultures of 1–3 l were grown in spinner flasks in medium supplemented with 1% penicillin–streptomycin antibiotics to approximately 107 cells per ml, and protein expression was induced with 4 μM CdCl2. After 5 days, the S2 medium supernatant was concentrated to 40 ml using a 10 kDa cut-off VivaFlow concentrator (Sartorius) and supplemented with Biolock (IBA) and 0.1 M Tris-HCl (pH 8.0), centrifuged for 30 min at 20,000g, and purified by Strep-Tactin affinity chromatography using a StrepTrap HP column (Cytiva). For the co-expression of soluble ANDV spikes and PCDH1 EC1–4, Strep-Tactin purification was followed by His affinity chromatography using the TALON column (Cytiva). Proteins were then purified by size-exclusion chromatography (SEC) on a 10/300 Superose6 Increase column (Cytiva) in 10 mM Tris pH 8.0, 100 mM NaCl. The protein purity and the presence of (Gn–Gc)4 spikes and PCDH1 in different SEC fractions after the co-expression were assessed by SDS–PAGE under reducing and non-reducing conditions.ANDV-VLPsTo obtain the complex of PCDH1–EC1 with ANDV-VLPs, the nucleic acid sequence of the first extracellular domain (amino acids 58–165) of human protocadherin 1 plus a C-terminal 5 × GGGS linker were codon-optimized, synthesized by GenScript, and inserted into the pCAG-ANDV-DM-VLP plasmid5 to make the pCAG-PCDH1-EC1-GS5-ANDV-DM-VLP plasmid. The insertion was between the ANDV native signal peptide sequence (1–18), predicted by the SignalP 5.0 server47, and the N-terminal residue of Gn. For protein expression, the pCAG-PCDH1-EC1-GS5-ANDV-DM-VLP plasmid was mixed with 25 kDa polyethyleneimine (PEI; Polysciences) and transfected into FreeStyle 293-F cells (Thermo Fisher Scientific) at a density of 106 cells per ml. Transfected cells were incubated in a 37 °C shaking incubator with 8% CO2 and 80% humidity for 72 h. After transfection, the supernatants were collected by centrifugation, filtered with 0.22 μm Rapid-Flow filters (Nalgene), and concentrated to about 40 ml using a Centricon Plus-70 filter unit (MilliporeSigma). The concentrated supernatant was subsequently purified through discontinuous sucrose density gradient (20%, 50%, 70% sucrose in PBS) ultracentrifugation at 4°C, 135,000g for 2 h. Fractions corresponding to VLPs were collected, pooled and further concentrated to around 60 μl in PBS (pH 7.4) for cryo-EM grid preparation.PCDH1 fragmentsTo obtain soluble His-tagged versions of human PCDH1 domains EC1–4 (sEC1–4), EC1–2 (sEC1–2) and EC1 (sEC1) for ELISA and BLI analyses, codon-optimized human PCDH1 fragments (amino acids 58–503 for sEC1–4, 58–284 for sEC1-2, and 58–160 for sEC1) were cloned into a pCAGGS (sEC1–4 and sEC1) or pcDNA3.1 (sEC1–2) plasmid in frame with a histidine tag. The sEC1–4 and sEC1 plasmids were used to transfect Expi293 (Thermo Fisher Scientific, A14527, not authenticated) at a density of 3 × 10⁶ cells per ml using FectoPRO DNA transfection reagent (Polyplus). After 5 days of incubation at 37 °C, the supernatant was collected and centrifuged for 30 min at 3,100g. Proteins were purified by TALON affinity chromatography followed by SEC on the HiLoad 16/600 Superdex 75 column (Cytiva) in 10 mM Tris pH 8.0 and 100 mM NaCl. The sEC1–2 plasmid, which also included a FLAG tag, was used to transfect FreeStyle 293-FS cells (Thermo Fisher Scientific) at a density of 1 × 10⁶ cells per ml using linear PEI (Polysciences). After incubation for 6 days at 37 °C, the supernatant was collected and clarified by centrifugation at 4,000 rpm for 20 min. Proteins were purified by nickel-chelation chromatography with Nickel-NTA resin (Qiagen). The protein was eluted in PBS containing 250 mM imidazole, and the buffer was exchanged with PBS.AntibodiesTo obtain full-length IgG versions of the monoclonal antibodies used in this study, synthetic variable regions of the light and heavy chains for each antibody were cloned into pCAGGS plasmids upstream of the corresponding human IgG1 constant regions. All antibodies were expressed in Expi293 cells as described above. Antibodies were purified by protein G affinity chromatography, eluted with 0.1 M glycine pH 2.7, neutralized with 1 M Tris-HCl pH 8.0 and further purified by SEC on the HiLoad 16/600 Superdex 200 column (Cytiva) in PBS. To obtain scFv versions of the monoclonal antibodies used in this study, we cloned the variable regions of the heavy and light chains joined by a linker (GTGGSGGGGSGGGGSGGGAS) into a pMT/BiP plasmid in frame with an enterokinase cleavage site and a double-Strep tag. These plasmids were used to generate stable transfectants of Drosophila S2 cells, as described above. Antibody fragments were purified by Strep-Tactin affinity chromatography using the StrepTrap HP column (Cytiva), followed by SEC on a HiLoad 16/600 Superdex 75 column (Cytiva) in PBS.Cryo-EM grid preparation and data collectionSoluble spike proteinsTo perform the cryo-EM studies, we diluted the purified soluble spikes alone or in a complex with PCDH1 EC1–4 to a concentration of 0.34 mg ml−1 in 10 mM Tris pH 8.0, 100 mM NaCl and deposited 3 μl on UltrAufoil R1.2/1.3 300 mesh copper grids that had been glow-discharged twice for 25 s in the PELCO easyglow cleaning system (15 mA, 0.3 mBar). After 5 s of wait time, excess protein was blotted away for 3 s using Whatman No.1 filter paper with a blot force of −1 at 15 °C in 100% humidity before being plunge frozen in liquid ethane using Vitrobot Mark IV (Thermo Fisher Scientific). Frozen grids were imaged on the Titan Krios POLARIS (Synchrotron Soleil) system equipped with a FALCON 4i detector (Thermo Fisher Scientific), operating in super-resolution mode at a magnification of ×165,000, corresponding to a calibrated pixel size of 0.7455 Å per pixel. A full description of the cryo-EM data-collection parameters is provided in Supplementary Table 1.ANDV-VLPsFor the VLPs, the R1.2/R1.3 300 mesh ultrAuFoil grids were glow-discharged with a setting of 20 mA, 1 min. Then, 3 μl concentrated PCDH1-EC1–GS5–ANDV-DM-VLP sample was added onto glow-discharged grids, blotted with a blot force of 4 and a blot time of 20 s and plunge-frozen into liquid ethane using a Vitrobot Mark IV (Thermo Fisher Scientific). The prepared grids were screened for optimal ice thickness on a 200 kV Glacios (Thermo Fisher Scientific) at The University of Texas at Austin. Screened grids were transferred to the cryo-EM facilities at UT Southwestern Medical Center (UTSW) for high-resolution data collection. Data collection was performed on the Titan Krios G4 (Thermo Fisher Scientific) system equipped with an X-FEG, K3 Summit camera (Gatan) and BioContinuum Imaging Filter (Gatan). A total of 18,507 videos was acquired at a pixel size of 0.413 Å, with a total dose of 56 e− Å−2 and a 15 eV energy filter slit width.EM data processing and model buildingSoluble spikesMotion correction, CTF estimation, particle picking, 2D classification, 3D classification and non-uniform 3D refinement were performed using cryoSPARC (v.4.6.2)48. For model building, the map was sharpened using DeepEMhancer49. The initial model was generated using ChimeraX50 by fitting the high-resolution ANDV tetramer structure (PDB: 9P3I)5 and the crystallographic structure of PCDH1 EC1 (PDB: 6BX7)26 in the electron density map. The model was further built manually in Coot51 and refined iteratively using phenix.refine52 using a refinement strategy that includes minimization_global, local_grid_search and adp, with rotamer and Ramachandran restraints. The full cryo-EM data processing workflow is shown in Supplementary Fig. 1 and the model refinement statistics are provided in Supplementary Table 1.ANDV-VLPsFor the VLPs, the data processing follows a similar pipeline reported for ANDV glycoprotein single tetramer5. In brief, the dataset was imported into CryoSPARC (v.4.6.2)48 for patch-based motion correction, contrast transfer function (CTF) estimation and exposure curation. A model manually trained on 200 motion-corrected, dose-weighted micrographs was then used to predict particle coordinates within crYOLO (v.1.9.9)53. Picked particles were then imported into CryoSPARC for particle extraction and 2D classification. The ANDV glycoprotein tetramer EM map was used as the reference for the homogeneous refinement to get the initial model. Then, recentring particles and particle re-extraction were performed, followed by rounds of homogeneous refinement with C4 symmetry, 3D classification, reference-based motion correction and non-uniform refinement. In the final round of 3D classification, to extract potentially different binding poses of PCDH1–EC1 to the ANDV tetramer, the particles were first symmetry expanded, and a 3D classification was performed on the expanded particle datasets with a sphere mask created in ChimeraX centred on the PCDH1 EC1 density. The classified particles were then locally refined, and the refined EM maps were sharpened by EMReady (v.2.0)54 to discriminate different binding poses.ELISAELISA plates (Thermo Fisher Scientific, 439454) were coated with 100 µl of recombinant His tagged PCDH1 EC1–4 (WT or double mutant) diluted to 10 µg ml−1 in PBS (pH 7.4). After overnight incubation at 4 °C, plates were washed three times with PBS containing 0.05% Tween-20 (PBS-T) and blocked with 250 µl per well of blocking buffer (PBS supplemented with 5% non-fat dry milk and 0.05% Tween-20). For the binding experiment with ANDV (Gn–Gc)4 spikes (Fig. 1b), serial dilutions of the spike were prepared in blocking buffer and 100 µl per well were added to the wells and incubated for 4 h at room temperature with agitation at 300 rpm. The plates were then washed as described above, and bound spike protein was detected by adding 100 µl per well of anti-Strep-tag monoclonal antibody (C23.21, Thermo Fisher Scientific, 910STRL) and incubating for 90 min at room temperature with agitation at 300 rpm. After washing, 100 µl per well of anti-mouse HRP-conjugated antibody (Jackson ImmunoResearch, 115-035-146, 1:10,000) was added and incubated for 60 min at room temperature. The plates were washed five times, and binding was detected using TMB substrate (ELISA 1-Step Ultra TMB, Thermo Fisher Scientific, 34028). The reaction was stopped with 50 µl per well of 2 M H2SO4, and the absorbance at 450 nm was measured using the Tecan Infinite M100 multimode microplate reader. Reported values correspond to the mean and s.d. from independent experiments, each performed in triplicate.For the competition experiments with soluble sEC1 WT or the double mutant (Fig. 1c) or with human IgGs or scFvs (Fig. 4b), purified protein or antibodies were either diluted to final concentrations of 10, 2, 0.4 and 0.08 µM in blocking buffer supplemented with 500 nM ANDV tetrameric spike protein or serially diluted (starting at 1.2 µM) and supplemented with 0.36 µl of FSL-biotin labelled rVSV-ANDV per dilution. After pre-incubation for 1 h at room temperature, the spike- or virus-competitor mixtures were added to the wells of WT PCDH1 EC1–4- or EC1–2-coated plates and the experiment proceeded as described in the previous paragraph.For rVSV chimera ELISAs, 96-well ELISA plates (Corning) were coated with purified sEC1–2 (100 ng per well) overnight at 4 °C, washed briefly with PBS and blocked with 5% non-fat dry milk in PBS (2 h at room temperature). rVSV chimeras were normalized based on Gc expression by western blotting (see specifics below) and membrane-labelled with a short-chain phospholipid probe, functional-component spacer diacyl lipid conjugated to biotin (FSL-biotin (5 µg ml−1); Sigma-Aldrich) for 1 h at 37 °C. The rVSVs were then serial diluted twofold and added to sEC1–2-coated wells (1 h at 37 °C). Bound rVSVs were detected by incubation with Pierce high-sensitivity Streptavidin–horseradish peroxidase (HRP) conjugate (1:10,000 dilution, Thermo Fisher Scientific). The ELISA signal was developed using 1-Step Ultra TMB-ELISA substrate solution (Thermo Fisher Scientific) and measured at an absorbance at 450 nm on the Cytation5 cell imaging multi-mode reader (Agilent BioTek Gen5 Microplate Reader and Imager software, v.3.2). Exact P values for Fig. 3b were as follows: ANDV versus SNV: 4.7 × 10⁻¹³, ANDV versus ANDVSNV-all: 0.62, ANDV versus ANDVSNV-CDLoop: 9.1 × 10⁻⁵ (left); SNV versus ANDV: 4.7 × 10⁻¹³, SNV versus SNVANDV-all: 4.7 × 10⁻¹³, SNV versus SNVANDV-CDLoop: 4.7 × 10⁻¹³ (middle); and HTNV versus ANDV: 1.1 × 10⁻¹², HTNV versus HTNVANDV-all: 8.9 × 10⁻⁷, HTNV versus HTNVANDV-CDLoop: 0.99 (right).BLI measurementsBLI data shown in this Article were produced using the Octet R8 (Sartorius). The BLI data shown in Fig. 1d were generated as follows. First, Ni-NTA sensors (Sartorius) were activated in 10 mM NiCl2 and then dipped into a solution of His-tagged PCDH1 EC1–4 at 2 μM in PBS pH 7.4 for 600 s. Next, sensors were quenched in solutions of PBS pH 7.4 with 500 nM His-tagged human TNF and 1 mg ml−1 BSA for 600 s. The functionalized sensors were then dipped into solution containing soluble spikes diluted at different concentrations (900, 300, 112, 100 and 33 nM) in PBS pH 7.4 supplemented with 1 mg ml−1 BSA (PBS-BSA) and finally moved to PBS-BSA for dissociation. Association and dissociation rates were recorded for 300 s. Non-specific interactions were monitored using a sensor coated with unrelated His-tagged protein (TNF) and signals were subtracted. The curves were processed using the Octet Analysis Studio software (v.13.0; Sartorius), and the KD values were obtained after fitting to a 1:1 global model.The BLI data shown in Extended Data Fig. 1b were generated as follows. First, Strep sensors (Sartorius, 18-0063) were dipped into a solution of strep-tagged (Gn–Gc)4 ANDV soluble spike at 20 nM in PBS pH 7.4 for 2,400 s. Next, sensors were quenched in solutions of PBS pH 7.4 with 100 nM strep-tagged Vaccinia virus D8 protein and 1 mg ml−1 BSA for 1,200 s. The functionalized biosensors were then dipped into solutions containing soluble PCDH1 EC1–4 at different concentrations (2,000, 1,000, 500 and 250 nM) in PBS pH 7.4 supplemented with 1 mg ml−1 BSA and finally moved to PBS-BSA for dissociation. Association and dissociation rates were recorded for 3,600 s, and non-specific interactions were monitored using a sensor coated with unrelated strep-tagged vaccinia D8 protein.Crystallization and structure determination of the complex GnH–MIB22For crystallization of the complex GnH–scFv-MIB22, we produced GnH (amino acids 21–374) of ANDV and the scFv of MIB22 in D. melanogaster S2 cells, as described above. We removed the purification tags using enterokinase before running SEC to isolate the complex, which was concentrated in 10 mM Tris-HCl pH 8.0 and 150 mM NaCl using Vivaspin centricons. Crystallization screening trials were performed using the vapour-diffusion method on the Mosquito nanodispensing system (STPLabtech) according to established protocols55. Crystals were grown in 0.2 M CaCl2, 0.1 M Tris-HCl pH 8.5, 20% (w/v) PEG 4000 and were cryo-protected with 20% (v/v) glycerol, followed by rapid transfer into liquid nitrogen. Diffraction images were integrated with XDS (v.10 January 2022)56, and crystallography calculations were carried out with programs from the CCP4 program suite (v.9)57. The structure was solved by molecular replacement with Phaser (v.2.8.2) from the suite PHENIX (v.1.19.2-4158)58 using PUUV GnH (PDB: 5FXU) and the scFv C10 of dengue virus (PDB: 4UT9) as search models. The final model was built by combining real space model building in Coot (v.0.9.8.92)51 with reciprocal space refinement with phenix.refine (v.1.14rc3). The final model was validated with Molprobity59. The crystallography statistics and PDB codes are provided in Supplementary Table 1. The structural analysis software was installed using SBGRID60.Cloning of pSHV-ANDV Gn librariesThe development of the SHV system, a Semliki Forest virus (SFV) replicon expressing an adaptively mutated ANDV Gn–Gc (Chilean field strain R123, GenBank: NP_604472.1) in place of its structural proteins in the pCMV-SFV4 plasmid61 to study hantavirus entry, will be described elsewhere (L.K. et al., manuscript submitted). Transfection of a single (pSHV-ANDV) plasmid encoding the SHV genome into Huh7.5.1 cells produces self-replicating viruses, enabling the genotype–phenotype link required for deep mutagenesis scanning of Gn–Gc proteins. To generate SHV Gn mutants encompassing amino acids 24–471 of its ectodomain, the Gn sequence was divided into six sections based on the availability of unique restriction sites: lib1 (amino acids 24–92), lib2 (amino acids 101–166), lib3 (amino acids 170–230), lib4 (amino acids 235–312), lib5 (amino acids 316–386) and lib6 (amino acids 390–471). The lib1 sequence was flanked by NruI (5′ end) and AclI (3′ end); lib2 by AclI (5′ end) and PspXI (3′ end); lib3 by PspXI (5′ end) and XmnI (3′ end); lib4 by XmnI (5′ end) and BbvCI (3′ end); lib5 by BbvCI (5′ end) and XmaI (3′ end); and lib6 by XmaI (5′ end) and BlpI (3′ end). Site-saturation variant libraries of oligo pools carrying single amino acid changes, with one codon per amino acid for all 20 amino acids, including the parental sequence, were synthesized by Twist Biosciences and cloned into the pSHV vector by digesting the vector at the corresponding restriction sites and assembling the fragments using NEB HiFi DNA assembly. The parental Gn sequence was also included in each library. The selected codons for each amino acid were optimal for human cell expression: Ala, GCC; Cys, TGC; Asp, GAC; Glu, GAG; Phe, TTC; Gly, GGC; His, CAC; Ile, ATC; Lys, AAG; Leu, CTG; Met, ATG; Asn, AAC; Pro, CCC; Gln, CAG; Arg, CGC; Ser, AGC; Thr, ACC; Val, GTG; Trp, TGG; and Tyr, TAC. The sequences of the assembled plasmid libraries were verified by Illumina MiSeq amplicon sequencing (see below for details).Generation and amplification of SHV librariesIndividual pSHV-ANDV sublibrary (lib1–6) plasmid pools were transfected using Lipofectamine-3000 according to the manufacturer’s instructions, at 10 μg per 100 mm plate of Huh7.5.1 cells, and SHVs were collected at 72 h after transfection to generate passage 0 stocks. To eliminate trans-complementation of dysfunctional Gn–Gc variants by parental SHV or other functional variants, the library was passaged twice at a multiplicity of infection (MOI) of 0.1 in Huh7.5.1 cells (a gift from C. M. Rice62 and F. V. Chisari63). Viral supernatants collected at passage 2 were clarified by centrifugation at 4,500 rpm at 4 °C for 15 min, repeated twice. Viruses in the clarified supernatant were concentrated by ultracentrifugation at 25,000 rpm at 4 °C for 1:45 h. The virus pellet was resuspended in 1× serum-free DMEM and incubated overnight at 4 °C. The resuspended pellet was then overlaid on a 10% sucrose cushion and ultracentrifuged at 25,000 rpm at 4 °C for 1:45 h. Subsequently, viral pellets were resuspended in 1× NT Buffer (10 mM Tris-Cl, 135 mM NaCl, pH 7.5) and stored at −80 °C before further downstream analysis. The SHV titres were estimated by immunostaining naive Huh7.5.1 cells infected with limiting dilutions of SHVs for expression of SFV non-structural protein 1 (nsP1) at 12 h after infection, using rabbit antisera (1:300) provided by A. Merits at the University of Tartu64, followed by an Alexa-Fluor-488-conjugated anti-rabbit secondary antibody (1:500).Pull-down of PCDH1-bound SHV particlesTo enrich PCDH1-binding SHV particles, a sEC1–2 capture ELISA was performed as described previously1,18. First, the amounts of SHV particles across the sublibraries and parental SHVs were normalized by labelling the pelleted SHV particle membranes with FSL-biotin (functional spacer di-acyl lipid probe conjugated to biotin) (Sigma-Aldrich). Equal amounts of FSL-biotin (10 μg ml−1) and pelleted SHVs were mixed and incubated at 37 °C for 1 h for labelling. Serial twofold dilutions of labelled SHVs were coated on a high-binding ELISA plate (Corning) at 37 °C for 1 h. After removing unbound virus and washing with 1× PBS three times for 5 min each, the wells were blocked with 5% non-fat dry milk (Bio-Rad) prepared in 1× PBS for 1 h at 37 °C. The FSL-labelled SHVs were detected using a high-sensitivity streptavidin-HRP conjugated antibody (BioLegend) at a final dilution of 1:3,000 after incubation at 37 °C for 1 h. The ELISA signal was developed using Ultra-TMB ELISA substrate (Thermo Fisher Scientific) and measured at 450 nm on the Cytation-5 multi-mode plate reader (BioTek, Agilent). SHV input amounts for the sEC1–2 capture ELISA for each sublibrary were calculated from half-maximum effective concentration values that were obtained by fitting the data to a sigmoidal four-parameter logistic model, with the logarithm of the virus amount on the x axis, using Prism GraphPad v.11.For the sEC1–2 capture ELISA, high-affinity 96-well ELISA plates (Corning) were coated with sEC1-2 (100 ng per well) at 4 °C overnight. The next day, after a single wash with 1× PBS, the plates were blocked with 5% blotting-grade non-fat dry milk (Bio-Rad) in 1× PBS for 1 h at 37 °C. Normalized amounts of pelleted parental and sublibrary SHVs labelled with FSL-biotin, as described above, were applied to the sEC1–2-coated wells for 1 h at 37 °C. After three thorough washes with 1× PBS to remove unbound SHVs, the bound viruses were processed for RNA isolation and PCR with reverse transcription (RT–PCR) as described below. Based on infectious units, sufficient SHV particles were included to ensure 1,000× coverage in the input of each sublibrary for the capture ELISA, and 10–12 wells per sublibrary were pooled for RNA isolation. For each capture ELISA, a parallel set of wells was processed for streptavidin–HRP-based detection of bound SHV particles, as described above for the normalization ELISA.Illumina sequencing of SHV genomesPCDH1-bound SHVs from independent biological duplicates for each sublibrary were processed by adding 50 μl of Zymogen RNA lysis buffer per well, incubating at room temperature for 8 min, and then isolating RNA using the Quick RNA Viral Kit according to the manufacturer’s instructions (Zymo Research). Input SHVs for each sublibrary were also sequenced to establish the baseline. cDNA was synthesized using the SuperScript III First-Strand Synthesis System (Invitrogen) according to the manufacturer’s instructions, with a reverse primer (5′-ATTGCCTACCCTAACACTAGTTGCAG-3′) located downstream of the Gn–Gc sequence. Sufficient viral RNA was used to ensure 1,000× coverage of each sublibrary. cDNA synthesis was followed by PCR with ANDV Gn-specific primers tagged at their 5′-ends with Illumina MiSeq adapters for the forward (5′-TCGTCGGCAGCGTCAGATGTGTATAAGAGACAG-3′) and reverse (5′-GTCTCGTGGGCTCGGAGATGTGTATAAGAGACAG-3′) sequences for each sublibrary. The sequences of the Gn-specific part of these primers were as follows: lib1-F, 5′-GTGCTATACTCTGACTCTCGCGATG-3′ and lib1-R, 5′- CGGTCTTTGTCTGTGCCTCAAAC-3′; lib2-F, 5′-CCACCAACGCAGCTTCCAC-3′ and lib2-R 5′-TTCTCATATATCACCTGTATCCTGTATCCTCGAGGT-3′; lib3-F, 5′-CTTGCATGGCCTCTGTGTTCAC-3′ and lib3-R, 5′-TGTGCACCCTGTCTTGGTGA-3′; lib4-F, 5′-AGCTGAAGGTGATCAAAACATTTGAAGG-3′ and lib4-R 5′-ACCCCGGCGAAAGCTGTC-3′; lib5-F, 5′-GTTCCTTCAACCTCTTCTACAGATACGC-3′ and lib5-R, 5′-TGTAGGCCTCGCAAGAAGCA-3′; and lib6-F, 5′-TGTTCTGTACTCTGGCCGGC-3′ and lib6-R, 5′-AGGGACACAGTTCGACGG-3′. Cycling conditions for the PCR were initial denaturation at 98 °C for 1 min; followed by 30 cycles of denaturation at 98 °C for 15 s, annealing at 65 °C for 30 s, extension at 72 °C for 30 s; and then a final extension step at 72 °C for 5 min. After verification of amplified PCR products on a 1% agarose gel, the products were purified using Ampure XP beads and indexed by a second round of PCR, followed by another cleanup with Ampure XP beads. Completed libraries were assessed by gel electrophoresis using the automated Agilent TapeStation D1000 Kit (Agilent Technologies) and quantified using the Qubit dsDNA BR Assay Kit (Thermo Fisher Scientific). Libraries were normalized to 40 nM, pooled and diluted to 4 nM. The 4 nM pool was denatured and diluted to 12.5 pM, then spiked with 10% Phi X DNA to increase base diversity. Paired-end 2 × 250 sequencing was performed on the Illumina MiSeq system using the Illumina MiSeq Reagent v2 kit (Illumina). Primary data analysis, base calling and quality scoring were performed using the onboard MiSeq Control Software v.4.1.0.480 and RTA v.1.18.54.4. Samples were demultiplexed, adapter sequences were trimmed and FASTQ files were generated for downstream analysis.Analysis of the SHV sequencing dataThe FASTQ files were aligned to the parental reference sequence using the Burrows–Wheeler Alignment Tool (BWA, v.0.7.17). Sequencing reads were processed using a custom Python-based DMS pipeline. Paired-end reads were first filtered to retain only high-quality sequences that (1) matched expected primer regions within defined mismatches; (2) had limited ambiguous base calls (N); and (3) showed sufficient overlap between R1 and R2 reads. Trimmed reads were merged, and coding regions were translated to protein sequences using a codon dictionary described above. To identify valid single amino acid variants, translated protein sequences were compared to the parental sequence. Only sequences differing by one amino acid and free of stop codons were retained. For each variant, the mutation position (adjusted by an offset to match full-length protein numbering) and substituted residue were recorded. Mutation counts were aggregated per position and normalized to compute the relative frequency of each variant, generating a position-wise matrix of single amino acid substitutions. These results were saved in a CSV file and used for downstream analysis.For each set (input and bound replicates), CSVs containing Mut_type, Mutation_count and Position_count were parsed to extract a numeric position from the leading digits of Mut_type (for example, 24C → 24) and define Variant = Mut_type. Variant-level enrichment in each bound replicate versus input was quantified using a smoothed within-position frequency with pseudocount pc = 0.5: freq = (mutation_count + pc)/(position_count + 2 pc), and enrichment was reported as log2[FC]= log2[freq_bound/freq_input]. For each variant, a two-sided Fisher’s exact test compared the variant versus all other reads at that position between bound and input using a 2 × 2 table (mut, nonmut=position_count−mutation_count), followed by Benjamini–Hochberg FDR correction per replicate. Reproducibility across bound replicates was assessed by Pearson/Spearman correlation of log2[FC] values and by calling variants reproducibly enriched/depleted if they had the same sign of log2[FC] in both replicates and FDR https://github.com/Jwang30/DMS_Calling).rVSVsReplication-competent rVSVs expressing an eGFP reporter and bearing hantavirus Gn–Gc of ANDV (NP_604472.1), SNV (NP_941974.1) or HTNV (NP_941978.1), with previously described modifications22, or chimeric variants of the three listed, were generated using a plasmid-based rescue system in HEK293T cells (ATCC, authenticated by short-tandem-repeat profiling) and propagated on Vero (ATCC, authenticated by karyotyping) or HUH7.5.1 (J. Carette, not authenticated) cells as described previously65,66. The constructs encoding the chimeric Gn–Gcs were cloned into the pVSV plasmid using standard molecular techniques. The chimera rVSVs contained residue swaps between ANDV and SNV, and ANDV and HTNV within the receptor-binding site, encompassing the three EC1-interacting loops (AB, CD and DE) or the CD-loop alone. Additional mutations were included to accommodate space for the loop swaps between the NWHs and OWHs. The comprehensive list of Gn amino acid changes in the ‘CD loop’ and ‘all’ chimeras is as follows (using ANDV numbering). CD Loop: ANDV residues 118–127 and adjacent residues 40 and 251. All: residues 35–38, 40, 118–127, 153, 156–157, 180, 195, 251, 257 and 413–419. A visual summary of all of the swaps within Gn is provided in Extended Data Fig. 4. After viral plaque purification, the sequences of all rVSV glycoproteins were amplified from viral genomic RNA by RT–PCR and analysed using Sanger sequencing.Infection inhibition and neutralization assaysTo evaluate the ability of PCDH1 to block infection of the rVSV chimeras, rVSVs bearing either WT or swapped PCDH1-interacting loops (all three loops: AB, CD, DE or CD alone) of ANDV/SNV and ANDV/HTNV were diluted to an MOI of 0.1 and incubated with threefold serial dilutions of soluble PCDH1 EC1–2 (WT or mutant containing the substitutions F83A and D85R) at room temperature for 1 h before being added to HUVEC (Thermo Fisher Scientific, authenticated by Invitrogen by cell morphology and cell-type-specific markers) monolayers in 96-well plates. rVSVs bearing ANDV Gn–Gc with HTNV-all residue swap did not readily infect HUVECs and therefore could not be evaluated. Exact P values for Fig. 3c (sEC1–2WT) were as follows: ANDV versus SNV: 1.0 × 10⁻¹⁵, ANDV versus ANDVSNV-all: 1.0 × 10⁻¹⁵, ANDV versus ANDVSNV-CDLoop: 1.6 × 10⁻⁷ (left); SNV versus ANDV: 1.0 × 10⁻¹⁵, SNV versus SNVANDV-all: 6.1 × 10⁻⁵, SNV versus SNVANDV-CDLoop: 8.9 × 10⁻³ (middle); and HTNV versus ANDV: 1.0 × 10⁻¹⁵, HTNV versus HTNVANDV-all: 5.4 × 10⁻⁹, HTNV versus HTNVANDV-CDLoop: 0.99 (right). Exact P values for Fig. 3c, bottom row (sEC1-2MUT) were as follows: ANDV versus SNV: 1.00, ANDV versus ANDVSNV-all: 0.69, ANDV versus ANDVSNV-CDLoop: 1.00 (left); SNV versus ANDV: 1.00, SNV versus SNVANDV-all: 0.68, SNV versus SNVANDV-CDLoop: 1.00 (middle); and HTNV versus ANDV: 0.02, HTNV versus HTNVANDV-all: 0.37, HTNV versus HTNVANDV-CDLoop: 0.71 (right). To compare the neutralizing activity of four full-length antibodies (ADI-65534, ANDV-34, ANDV-5, and MIB22), rVSV-ANDV (MOI 0.1) was incubated with threefold serial dilutions of each antibody, starting at 33 nM, for 1 h before being added to HUVECs cultured in 96-well plates. For all infections, cells were fixed 14–16 h after infection with 4% formaldehyde (Sigma-Aldrich) and counterstained with Hoechst nuclear stain (Invitrogen). The number of infected cells (GFP-positive cell counts) and viral infectivity (the percentage of GFP-positive cells) were quantified by automated enumeration of eGFP-expressing cells from images acquired using the Cytation 5 Cell Imaging Multi-Mode Reader with Agilent BioTek Gen5 Microplate Reader and Imager software (BioTek, v.3.2).ImmunoblottingTo normalize the amount of each virus used for rVSV–sEC1–2 ELISAs, the level of glycoprotein (Gc) incorporation was quantified by immunoblotting. rVSV particles bearing ANDV or SNV Gc were detected using an anti-hantavirus Gc rabbit pAb 16281 made from immunized rabbits with the peptide containing ANDV Gc amino acids 1067–1087 (Pacific Immunology). The rVSVs bearing ANDV or HTNV Gc were detected using a mouse anti-hantavirus Gc clone 2H4/F6 monoclonal antibody67. Both antibodies were diluted in 1% NFDM and blots were stained for 1 h at room temperature, followed by washing with PBS with 0.01% Tween-20 (PBST), and incubation with an anti-rabbit IgG Alexa Fluor Plus 680 pAb (Thermo Fisher Scientific), an anti-mouse IgG Alexa Fluor 680 pAb (Thermo Fisher Scientific) or an anti-mouse IgG IRDye-800CW pAb (LI-COR) for 1 h at room temperature. After thoroughly washing with PBST, blots were imaged on the iBright FL1500 Imaging System and analysed using the iBright Analysis Software. The chimera rVSVs were normalized to their WT parent based on the amount of incorporated glycoprotein. Uncropped and unprocessed scans of the blots are provided in Supplementary Fig. 1.Detection of soluble PCDH1 bound to Gn–Gc-expressing cells by flow cytometryTo evaluate the binding of sEC1 to ANDV glycoproteins displayed within a membrane, Vero cells seeded in six-well plates were infected with rVSVs expressing eGFP, bearing either ANDV or HTNV Gn–Gc with an MOI of 0.3 IUs per cell for 1 h. Infection was stopped by the addition of NH4Cl (20 mM). At 14 h after infection, cells were collected with a cell scraper and blocked with chilled 10% FBS in PBS for 30 min at 4 °C. Cells were then incubated for 1 h at 4 °C with soluble PCDH1 EC1–2 (500 nM or 1000 nM) or buffer only (10% FBS in PBS) as a negative control. After multiple washes with PBS, cells were fixed with 4% formaldehyde (Sigma-Aldrich) for 5 min at 4 °C and washed once with PBS. To detect bound sEC1–2, cells were incubated with a mouse anti-DDK(FLAG)-DyLight-594 monoclonal antibody (Thermo Fisher Scientific) for 1 h at 4 °C, followed by multiple washes with PBS. Cells were then resuspended in 2% FBS in PBS, passed through a 41 µm nylon net filter (Millipore) and analysed using the LSR II flow cytometer and FlowJo v.10 software. The gating strategy is provided in Supplementary Fig. 2.Figure preparation and visualizationMolecular representations were prepared using PyMol v.3.0.3 (Schrödinger) and ChimeraX (v.1.6.1)50. The panels in Fig. 1a were generated using the web server IBS (v.2.0)68 and the Extended Data Fig. 4a using the server ESPRIPT69,70,71,72. Extended Data Fig. 6a was generated using Seaborn (v.0.13.2)73. Graphs were generated using GraphPad Prism (v.11). Figures were assembled and edited using Adobe Illustrator (v.28.5).Reporting summaryFurther information on research design is available in the Nature Portfolio Reporting Summary linked to this article.