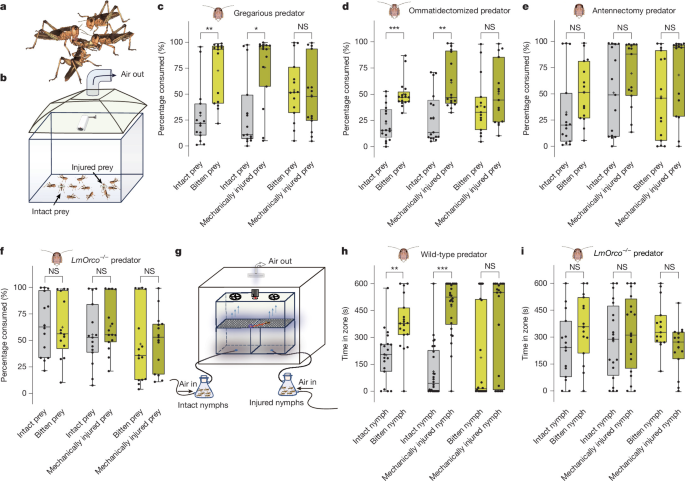
InsectsGregarious and solitarious L. migratoria used in this study were originally collected in Guangxi, China, and subsequently maintained at the Shenzhen Agricultural Genomics Institute, Chinese Academy of Agricultural Sciences. For establishment of stable phase lines, locusts were reared under strictly controlled density conditions for at least three laboratory generations before experimentation. Gregarious locusts were maintained at high population density in ventilated cages (35 cm × 35 cm × 50 cm), each containing 400–500 first-instar nymphs. Solitarious locusts were reared individually in cylindrical containers (10.8-cm height, 8-cm diameter) equipped with independent ventilation to prevent exposure to crowding-associated visual, tactile or olfactory cues. All locusts were kept under standardized environmental conditions, including a 14 h:10 h light/dark photoperiod, temperature of 30 ± 2 °C and relative humidity of 50 ± 5%. Fresh wheat seedlings were provided ad libitum as food throughout rearing and experimental periods. For experiments involving allocation of locusts or biological samples to different treatment groups, individuals or samples were randomly assigned to experimental groups where applicable. Experimental animals were selected from the same phase, developmental stage and rearing conditions, and relevant experimental variables, including feeding status, environmental conditions and experimental procedures, were standardized across treatment groups. For dual-choice behavioural assays, the positions of treatment and control stimuli were alternated between successive trials to minimize positional bias. In experiments in which groups were intrinsically defined by genotype, injury status or severity, microbial status, pathogen treatment, developmental stage, time point, or other experimentally imposed conditions, random allocation to the defining condition was not applicable. In these experiments, comparisons were performed using animals or samples matched for relevant biological characteristics and maintained under otherwise identical experimental conditions. No additional covariate-based allocation was required because the major potential covariates relevant to each experiment were controlled by the experimental design.Locust predation assayPredatory preferences of gregarious L. migratoria nymphs were quantified using dual-choice predation assays conducted in a rectangular acrylic arena (20 cm × 10 cm × 10 cm) under well-ventilated laboratory conditions. Fifth-instar gregarious nymphs were used as predators, whereas gregarious prey nymphs of defined developmental stages (first to fifth instar, depending on the experiment) were used as prey. Before each assay, predator nymphs were starved for 24 h to standardize feeding motivation. To assess predation preference between intact and injured prey, ten fifth-instar gregarious nymphs were introduced into the arena as predators. Two prey nymphs were placed at opposite ends of the arena: one prey individual was left intact, whereas the other was injured. Injuries were generated either mechanically using a sterile scalpel or by controlled conspecific attack, producing wounds of comparable size at a standardized location on the abdominal cuticle. To eliminate potential confounding effects arising from differences in locomotor ability, prey individuals were immobilized at fixed positions using adhesive tape. Predation assays were performed using predators that were either intact or had been subjected to sensory manipulations, including antennal ablation to disrupt primary olfactory input, knockout of olfactory coreceptor LmOrco to impair odorant-receptor-mediated olfaction, or removal of the compound eyes to disrupt visual input. To test whether injury-associated chemical cues influenced predation decisions, dual-choice assays were conducted using guaiacol-treated and solvent-treated prey. In these experiments, 10 predators were simultaneously presented with two prey nymphs, one perfumed with 2 μl of 10−4 guaiacol and the other treated with solvent alone as a control. To evaluate the contribution of gut microbiota to predation preference, we performed further dual-choice assays using germ-depleted prey. For comparisons between E. hormaechei-infected and control prey, ten predators were presented with two injured prey nymphs, one infected with E. hormaechei and the other treated with sterile LB medium. To determine the role of bacterial guaiacol biosynthesis, we further compared predation preference between injured prey infected with wild-type E. hormaechei and a vdc-mutant strain. All microbiota-related assays were conducted as described above, except that prey individuals were allowed to move freely during the assay. In all experiments, prey individuals were weighed immediately before introduction into the arena. After a predation period of 1 h, remaining prey were retrieved and reweighed. Predation preference is expressed as the percentage of total prey body mass consumed for each prey individual. All assays were video-recorded and analysed using EthoVision XT 18.0 software (Noldus Information Technology). Behavioural parameters including attack latency, bite frequency and cumulative bite duration, and the spatial distribution of predator–prey interactions were quantified from the recordings.Dual-choice behavioural assaysBehavioural responses of L. migratoria to volatile compounds were assessed using a two-choice olfactometer14,20. The apparatus consisted of two plastic odour source containers (28 cm × 28 cm × 18 cm) with open tops, each seamlessly connected to a central glass behavioural observation chamber (60 cm × 30 cm × 30 cm). The top of each container was covered with a perforated plastic plate (1-mm-diameter holes spaced 1 cm apart) to allow uniform airflow into the observation chamber. Clean air was supplied to each odour source container from a compressed air cylinder and sequentially filtered through a charcoal filter and a molecular sieve for removal of contaminants. Airflow through each side of the arena was regulated by a flowmeter at a constant rate of 4 l min−1. The glass chamber enclosed the region above the perforated plates and served as the behavioural observation zone. Two fans mounted at the top of the chamber generated a stable vertical airflow, ensuring homogeneous odour distribution. A high-definition digital video camera positioned between the fans continuously recorded locust behaviour. All assays were conducted in a dedicated observation room (60 cm × 70 cm × 80 cm) equipped with a ventilation system and uniform illumination provided by ceiling-mounted white light panels. Before each assay, individual locusts were starved for 24 h. Individual locusts were gently introduced into the centre of the observation chamber and allowed to explore freely for 10 min. During each assay, a control odour (intact fourth-instar prey, paraffin oil or LB medium, depending on the experiment) was delivered to one side of the olfactometer, while the test odour was delivered to the opposite side through the vertical airflow. Test odour sources included volatiles emitted from 6 intact or injured 4th-instar gregarious nymphs, guaiacol applied at concentrations ranging from 10−7 to 10−2 (dilution), or bacterial suspensions (cultured with 15 ppm vanillic acid) at 105 CFU ml−1. Odorants were applied to a piece of filter paper (3 cm × 3 cm) placed inside the corresponding odour source container. To minimize positional bias, we alternated the locations of the odorant and control sides between successive trials. After 8–10 individuals had been tested, the containers were thoroughly cleaned with 75% ethanol and ventilated for 30 min for elimination of residual odours. Locust behaviour was recorded at 30 frames per second, and the total time spent on each side of the arena was quantified manually and used as the behavioural response metric. For group-choice assays, five gregarious nymphs were released simultaneously into the observation chamber. Behavioural recordings were analysed using EthoVision XT 18.0 software (Noldus Information Technology), and the average residence time of the group on each side of the olfactometer was used for quantitative analysis. In the two-choice behavioural assay, locust behaviour was recorded for 10 min (600 s). During this period, most locusts remained either on the odour-treated side or on the control side. Consequently, the sum of the time spent on the odour-treated and control sides was 600 s for most individuals, explaining why the corresponding raw behavioural data frequently summed to 600 s.Semi-field predation assayTo assess whether guaiacol promoted cannibalism under semi-field conditions, predation assays were conducted in outdoor mesh enclosures (1.8 m × 1.2 m × 1.5 m). Each enclosure contained 100 4th-instar gregarious nymphs as prey and 500 5th-instar gregarious nymphs as predators. Before each assay, predator nymphs were starved for 24 h for standardization of feeding motivation. In the control group, all prey nymphs were treated with 2 μl of solvent, whereas in the guaiacol group, each prey nymph was treated with 2 μl of a 10−4 dilution of guaiacol applied to the dorsal thorax. After 24 h, the remaining live 4th-instar nymphs were recovered and counted. The cannibalism ratio was calculated as the proportion of prey nymphs lost after 24 h relative to the initial number released.Chemical analysisVolatile compounds emitted from locust bodies, haemolymph, gut-derived microbial cultures, and bacterial cultures were analysed using SPME coupled with GC–MS. For whole-body volatile analysis, defined numbers of gregarious L. migratoria (1st to 5th instar and adult) or germ-depleted 4th-instar nymphs were placed into 100-ml glass bottles. A 65-µm polydimethylsiloxane/divinylbenzene (PDMS/DVB) SPME fibre (Supelco) was inserted into the bottle headspace through the cap using a PEAK guide piece to prevent direct contact with the insects. Headspace volatiles were collected at 30 °C for 1 h.For analysis of volatiles derived from gut- and haemolymph-associated microbial communities, gut contents and haemolymph samples were collected aseptically and cultured in LB medium at 30 °C with shaking at 200 rpm for 12 h. The resulting enrichment cultures were transferred to 20-ml headspace vials, and headspace volatiles were collected for 30 min using the same PDMS/DVB SPME fibre. For screening of guaiacol-producing bacterial strains, isolates were cultured in LB medium containing 15 ppm vanillic acid at 30 °C with shaking at 200 rpm for 12 h. A 5-ml aliquot of each bacterial suspension was then transferred to a 20-ml headspace vial, and volatile compounds were collected for 30 min. Volatiles of the control strain lacking vdc were analysed by the same method.For direct haemolymph volatile analysis, approximately 100 µl of haemolymph was collected from 20 gregarious 4th-instar nymphs and transferred on to a filter paper (2 cm × 5 cm) placed in a 20-ml glass vial. A 65-µm PDMS/DVB SPME fibre was inserted into the vial headspace, and volatile collection was performed at 30 °C for 30 min. For analysis of volatile emissions from E. coli strains expressing the vdc gene cluster, bacterial cultures were grown in LB medium at 37 °C with shaking at 200 rpm until the optical density at 600 nm reached 0.6–1.0. Isopropyl β-d-1-thiogalactopyranoside was then added to a final concentration of 0.5 mM to induce expression of Vdc. After 6 h of induction, vanillic acid was supplemented to a final concentration of 15 mg l−1, and incubation was continued for a further 6 h. A 5-ml aliquot of the induced culture was subsequently transferred to a 20-ml headspace vial, and volatiles were collected for 30 min using the same SPME fibre.Volatiles from all samples except microorganism-related samples were analysed using a Thermo Scientific Orbitrap GC–MS system equipped with a WAX capillary column (30 m × 0.25-mm inner diameter, 0.25-µm film thickness). The oven temperature program consisted of an initial hold at 50 °C for 3 min, ramping to 150 °C at 5 °C min−1, followed by an increase to 260 °C at 10 °C min−1 and a final hold at 260 °C for 5 min. Volatile compounds were identified by comparison with synthetic standards and by matching of mass spectra to the NIST 2020 mass spectral library. Synthetic reference compounds were obtained from Sigma-Aldrich.Volatiles from microorganism-related samples, including E. hormaechei, K. pneumoniae and E. coli cultures, were analysed using a SHIMADZU Nexis GC-2030 system equipped with a DB-5 capillary column (30 m × 0.25-mm inner diameter, 0.25-µm film thickness). The oven temperature was held at 40 °C for 3 min, increased to 150 °C at 5 °C min−1 and held for 1 min, then ramped to 260 °C at 10 °C min−1 with a final hold of 5 min. Chemical identification was performed by comparison with synthetic standards and NIST library matches.Generation of germ-depleted nymphsTo generate germ-depleted fourth-instar L. migratoria nymphs, we applied a cocktail of antibiotics (tetracycline, streptomycin and ciprofloxacin)17,18,19 to autoclaved wheat seedlings, which were then provided as food to second instar nymphs. Antibiotic-treated seedlings were supplied continuously until the insects reached the fourth instar. At this stage, six nymphs were randomly selected for GC–MS analysis to verify depletion of guaiacol-emitting microbiota. Only nymphs in which guaiacol emission was no longer detectable were considered to be germ-depleted and used for downstream experiments.Cloning of LmORsAntennae were dissected from gregarious L. migratoria nymphs (10–20 antennal pairs in total) and pooled for RNA extraction. Total RNA was isolated using TRIzol reagent (Invitrogen) according to the manufacturer’s instructions. First-strand cDNA was synthesized from 5 µg of pooled total RNA using a HiScript III 1st Strand cDNA Synthesis Kit (Vazyme Biotech). Gene-specific amplification of odorant receptor (LmOR) coding sequences was performed using 2× Phanta Max Master Mix (Dye Plus) with primers designed on the basis of the antennal transcriptomic dataset. PCR products were separated by 1.0% (w/v) agarose gel electrophoresis, excised and purified before being subcloned into a blunt-end cloning vector (TransGen Biotech). All inserts were confirmed by Sanger sequencing. For each LmOR gene, sequences from at least four independent bacterial clones were aligned to enable us to distinguish genuine sequence polymorphisms from PCR-induced artefacts.Transgenic expression of LmORs in D. melanogaster at1 neuronsThe entire olfactory receptor coding sequences were cloned into the pUAST.attB expression vector (a gift from J. Bischof) with both XbaI and NotI restriction sites (New England Biolabs). Transgenic D. melanogaster lines harbouring UAS-ORX constructs integrated into chromosome II were generated by the CAS Center for Excellence in Molecular Cell Science (https://sjzx.sibcb.ac.cn/Cn/Index/pageView/catid/105.html). To achieve targeted expression of ORX in at1 olfactory neurons, we crossed each transgenic UAS-ORX line with the Or67d-GAL4 driver line (provided by B. J. Dickson). Through successive genetic screening and selection, we established stable homozygous transgenic lines in which the olfactory receptor transgene was specifically expressed in at1 neurons. The presence and sequence integrity of the transgenes were confirmed by genomic DNA extraction and sequencing of adult flies.Single-sensillum recordingsTo characterize the functional properties of individual locust olfactory receptors in the Drosophila empty neuron system, we performed SSRs from T1 sensilla of adult flies following established protocols with minor modifications14,20. Briefly, adult flies were immobilized in pipette tips, and the third antennal segment was positioned stably on a glass coverslip. Sensillum subtypes were visualized under an Olympus BX51WI microscope at ×100 magnification and unequivocally identified using diagnostic odorants detailed in Extended Data Table 2. Extracellular recordings of olfactory sensory neuron activity were acquired by insertion of a tungsten microelectrode into the base of the target sensillum, with a reference electrode placed in the compound eye. Signals were amplified (Syntech Universal AC/DC Probe), digitized (96,000 samples per second), and filtered (500–3,000 Hz) using an Intelligent Data Acquisition Controller (Syntech) connected to a computer. Neural spike data were extracted and analysed using AutoSpike software (v.32, Syntech).Synthetic odorant compounds were freshly diluted in paraffin oil (Sigma-Aldrich). For each stimulation, 10 µl of the diluted odorant was freshly loaded on to a 1-cm2 piece of filter paper and inserted into a glass Pasteur pipette. Odour delivery was achieved by introducing the pipette tip into a constant, humidified airstream (600 ml min−1) flowing through a stainless steel tube with an 8-mm inner diameter, positioned 1 cm from the fly antenna. Neural activity was recorded for 10 s, encompassing a 3-s prestimulation baseline period followed by a 0.5-s odour pulse. Olfactory sensory neuron responses were quantified as the fold change in action potential frequency (spikes per second) relative to the prestimulation baseline. Raw traces were processed by means of amplitude-based spike sorting in AutoSpike, with subsequent data analysis performed in Microsoft Excel and visualization using Adobe Illustrator CS (Adobe Systems).In addition, SSRs were conducted on basiconic and trichoid sensilla of locusts using functional ligands identified in the Drosophila empty neuron. Locusts were restrained in 1-ml plastic tubes, with their antennae immobilized using dental wax. Recording parameters and data analysis pipelines were identical to those used for Drosophila SSRs.ElectroantennographyElectroantennograms were recorded from the fifth-instar nymph of the locust. Briefly, the locust antenna was transected at the base of the flagellum, and the freshly cut end was immediately inserted into a glass capillary filled with locust Ringer’s solution (0.1 mol l−1 KCl). Of two such capillaries containing Ag–AgCl electrodes, one served as the ground electrode, and the other was linked to a high-impedance DC amplifier (10× gain; Syntech). Signals were transmitted to an IDAC-4 analog-to-digital converter (Syntech) and subsequently acquired by a computer. Raw data were analysed and archived using EAGPro software (v.3.7, Syntech).Odorant delivery followed a standardized protocol: 10 µl of diluted odorant (prepared as described in the ‘Single-sensillum recordings’ section) was loaded on to a 1-cm2 filter paper, which was inserted into a glass Pasteur pipette, and the pipette tip was introduced into a constant, humidified airstream (600 ml min−1) flowing through a stainless steel tube with an 8-mm inner diameter. The tube outlet was positioned 1 cm from the antenna to ensure consistent stimulus delivery. EAG recordings were 10 s in duration, comprising a 3-s prestimulation baseline and a 0.5-s odour pulse.CRISPR–Cas9-mediated knockout of olfactory receptor genes in locustsMutant lines of LmOrco, LmOR34, LmOR36 and LmOR39 were generated using CRISPR–Cas9-mediated genome editing with minor modifications to established protocols14,20. Fertilized eggs were collected from freshly deposited egg pods, surface-sterilized with 75% (v/v) ethanol and arranged on 1% (w/v) agarose gels for microinjection. Cas9 protein (150 ng μl−1) and gene-specific single-guide RNAs (400 ng μl−1; target sequences provided in Extended Data Table 3) were coinjected into individual embryos (approximately 27.2 nl per embryo) using a nanolitre microinjector (SYS-PV850, World Precision Instruments) fitted with custom-pulled borosilicate glass capillaries under a stereomicroscope. Injected embryos were incubated at 30 °C until hatching (approximately 12 days).G0 nymphs were reared under standardized laboratory conditions in mesh cages (35 cm × 35 cm × 50 cm) under a 14 h:10 h light/dark photoperiod, with ad libitum access to fresh wheat seedlings at 30 °C and 60% relative humidity. Genomic DNA was extracted from adult leg tissue by alkaline lysis (45-μl mixture of 50 mM NaOH and 0.2 mM EDTA, 95 °C for 20 min), followed by neutralization with 5 μl of 1 M Tris-HCl (pH 8.0). A 2-μl aliquot of the resulting lysate was used as a template for PCR amplification of the target genomic loci.PCR reactions (25 μl total volume) contained 12.5 μl of 2× Phanta Max Master Mix (Dye Plus), 1 μl each of gene-specific forward and reverse primers (10 μM), and 8.5 μl of nuclease-free water. Thermocycling conditions were as follows: initial denaturation at 95 °C for 3 min; 38 cycles of 95 °C for 15 s, 60 °C for 15 s and 72 °C for 45 s; followed by a final extension at 72 °C for 5 min.PCR amplicons were subjected to Sanger sequencing, and mutations were verified by alignment with the wild-type reference sequence. Confirmed G0 mutants were crossed with wild-type individuals to generate G1 progeny, and a distinct deletion allele was used to track inheritance. G1 heterozygotes were intercrossed, and homozygous mutants were identified in the G2 generation by locus-specific PCR genotyping (primer sequences provided in Extended Data Table 3). Stable homozygous mutant lines were established through repeated intercrossing and confirmed by sequencing.Metagenomic sequencingIntestinal contents and haemolymph were collected from a population from our laboratory (Shenzhen, Guangdong, China). Another six geographically distinct locust populations from across China were also collected, and the total DNA was extracted from the locust intestinal contents using a QIAamp Fast DNA Stool Mini Kit (Qiagen) according to the manufacturer’s instructions. DNA concentration was measured with a NanoDrop 2000 spectrophotometer (Thermo Fisher Scientific), and DNA integrity was assessed by agarose gel electrophoresis. Genomic DNA was fragmented using a Covaris S220 Focused-Ultrasonicator (Covaris) and purified with Agencourt AMPure XP beads (Beckman Coulter). Metagenomic libraries were prepared using a TruSeq Nano DNA LT Sample Preparation Kit (Illumina) following standard protocols. Library construction, high-throughput sequencing and initial data processing were performed by OE Biotech.Libraries were sequenced on an Illumina NovaSeq 6000 platform to generate 150-bp paired-end reads. Raw sequencing reads (FASTQ format) were quality-filtered for removal of low-quality bases and adapter sequences using Trimmomatic (v.0.36). Host-derived reads were identified by alignment to the L. migratoria reference genome using Bowtie2 (v.2.2.9) and subsequently discarded. The remaining high-quality, host-depleted reads were assembled de novo into metagenomic scaffolds using MEGAHIT (v.1.1.2). Scaffolds were split at internal gaps into contiguous sequences (scaftigs), and only scaftigs with lengths at least 500 bp were retained for downstream analyses.Open reading frames were predicted from the assembled scaftigs using Prodigal (v.2.6.3) and translated into amino acid sequences. For construction of a non-redundant gene catalogue, all predicted open reading frames were clustered using CD-HIT (v.4.5.7) with a sequence identity threshold of 95% and a coverage cutoff of 90%; the longest sequence within each cluster was selected as the representative gene. Clean reads from each sample were then mapped back to the non-redundant gene set using Bowtie2 (v.2.2.9) with a 95% identity threshold to estimate gene abundance.Taxonomic annotation of the non-redundant gene set was performed by alignment against the NR protein database. Species abundance profiles were inferred on the basis of gene abundance, and taxonomic abundance statistics were summarized across hierarchical levels, including domain, kingdom, phylum, class, order, family, genus and species.Identification of microbial strains synthesizing guaiacolTo identify bacterial strains responsible for guaiacol biosynthesis, we isolated microbial communities from the gut contents and haemolymph of fourth-instar gregarious L. migratoria nymphs. Eluted microbial suspensions were initially cultured in LB medium at 37 °C for 12 h for enrichment of bacterial populations. Cultures were then serially diluted 10-fold to 10−5, which represented the highest dilution that still emitted detectable guaiacol. A 10-µl aliquot of the 10−5 dilution was spread on to LB agar plates and incubated overnight at 37 °C. Individual colonies were randomly selected and screened for guaiacol production. Each isolate was grown in LB medium, and headspace volatiles were collected using a SPME fibre, followed by analysis using GC–MS. Isolates confirmed to emit guaiacol were subjected to whole-genome sequencing, and genomic analysis identified the guaiacol-producing strain as E. hormaechei.Targeted deletion of the vdc gene cluster in E. hormaechei
Targeted deletion of the vdc gene cluster in E. hormaechei was achieved using a homologous recombination-based allelic exchange strategy. Briefly, a DNA fragment encompassing the vdc gene and its homology arms about 500 bp upstream and downstream was amplified from wild-type E. hormaechei genomic DNA using specific primers (Extended Data Table 3). The resulting fragment was cloned into the TOPO vector, which subsequently served as a template for amplification of sequences containing an ampicillin resistance cassette and the upstream and downstream homology arms of the vdc genes, using primers TOPO-Vdc-F and TOPO-Vdc-R (Extended Data Table 3). These primers were designed with 15- or 18-nucleotide overhangs at their 5′ ends, homologous to the downstream region and the kanamycin resistance cassette, respectively. The kanamycin resistance cassette from the TOPOloxp-Kana vector was amplified using primers Loxp71F and Loxp66R (Extended Data Table 3). The amplified cassette was then fused with the fragment amplified by TOPO-Vdc-F/R through homologous recombination to generate a circular plasmid.The recombinant plasmid was digested with PstI, and the recovered fragment was introduced into E. hormaechei by electroporation (1.8 kV, 25 μF, 200 Ω; Bio-Rad Gene Pulser Xcell or equivalent), and transformants were recovered in antibiotic-free LB medium at 37 °C for 2 h with shaking at 200 rpm. We performed selection for chromosomal integration by plating cells on to LB agar containing 50 mg l−1 kanamycin and incubating them overnight at 37 °C. The single colonies were picked up and cultured in the LB selection broth containing 50 mg l−1 kanamycin and incubated at 37 °C for 12 h. Correct integration events were verified by colony PCR and Sanger sequencing using locus-specific primers Vdc-test.F/R (Extended Data Table 3).Prokaryotic expression of E. hormaechei Vdc proteinsThe vdc locus of E. hormaechei comprises three tandemly arranged genes (vdcB, vdcC and vdcD), which together encode the functional decarboxylase complex. To reconstitute this enzymatic system in a heterologous host, we cloned the complete vdc gene cluster and expressed it in E. coli. Primers were designed to amplify the full-length cluster with flanking homology arms compatible with a double-digested pET28a expression vector (Extended Data Table 3), enabling seamless recombination-based insertion of the intact operon. The amplified fragments were purified and assembled into the linearized pET28a backbone by homologous recombination. Recombinant constructs were selected on kanamycin-containing LB agar and sequence-verified by Sanger sequencing to ensure fidelity of the coding regions. Sequence-confirmed plasmids were introduced into E. coli BL21, a strain optimized for inducible protein expression. Transformants were expanded under antibiotic selection, and overnight cultures were used to establish standardized seed cultures for expression assays.To induce production of the Vdc complex, seed cultures were diluted into fresh LB medium containing kanamycin and grown to mid-log phase (optical density at 600 nm: 0.6–1.0), at which point protein expression was initiated by addition of isopropyl β-d-1-thiogalactopyranoside (final concentration 0.5 mM). Induction was carried out at a reduced temperature (28 °C) to favour proper protein folding and complex assembly. Samples were collected before and after induction to enable direct comparison of expression efficiency. Cells were collected and lysed under conditions designed to preserve protein solubility. Pellets were resuspended in a high-salt glycerol-containing binding buffer supplemented with protease inhibitor and lysozyme, followed by controlled sonication on ice. Soluble and insoluble protein fractions were separated by centrifugation, allowing assessment of Vdc expression levels and solubility. Expression and partitioning of the Vdc proteins were evaluated by SDS–PAGE analysis. Equivalent aliquots of soluble and insoluble fractions were denatured, resolved on precast polyacrylamide gels, and visualized by Coomassie Brilliant Blue staining. Gel images were recorded to document expression of the recombinant Vdc proteins and their distribution between soluble and inclusion body fractions.Locust pathogen infection and survival assaysTo evaluate the virulence of pathogenic isolates in locusts, fourth-instar nymphs were injected with P. mirabilis (200 nl, 104 CFU ml−1), M. anisopliae (200 nl, 106 CFU ml−1) or E. faecalis (200 nl, 104 CFU ml−1), respectively. Control insects were injected with an equivalent volume of phosphate-buffered saline (PBS). Survival was monitored at 12-h intervals, and each treatment group consisted of 60 or 80 nymphs.To determine whether guaiacol production by E. hormaechei enhanced host survival following injury, we conducted locust pathogen challenge assays under controlled microbial, dietary, genetic and injury conditions. Germ-depleted nymphs were first generated to eliminate confounding effects of resident microbiota. Wheat seedlings were immersed in either sterile water (control) or sterile water supplemented with wild-type E. hormaechei (103 CFU ml−1), a vdc-mutant strain (103 CFU ml−1) or guaiacol (10−4). After 24 h of feeding on these diets, nymphs were subjected to standardized abdominal wounding, followed by inoculation of the wound site with either P. mirabilis (200 nl, 104 CFU ml−1), M. anisopliae (200 nl, 106 CFU ml−1) or E. faecalis (200 nl, 104 CFU ml−1). Survival was monitored at 12-h intervals, and each treatment group comprised 100–120 nymphs. To directly link mortality outcomes to infection severity, we collected independent cohorts that had been subjected to identical dietary treatments for pathogen load quantification 2 days (P. mirabilis and E. faecalis) or 4 days (M. anisopliae) after inoculation.To test whether the protective effects of guaiacol and E. hormaechei depended on host innate immune signalling, we performed parallel infection assays in double-stranded RNA (dsRNA)-treated nymphs, targeting components of the Toll and Imd pathways. At 12 h after dsRNA injection, P. mirabilis (100 nl, 104 CFU ml−1) or M. anisopliae (100 nl, 106 CFU ml−1) was delivered using a WPI UMP3 microinjector. Survival was recorded every 12 h, with 80–100 nymphs per treatment, and corresponding cohorts were sampled for haemolymph pathogen load 3 days (P. mirabilis) or 5 days (M. anisopliae) after inoculation.To further examine whether gregarious predator nymphs benefited from consumption of injured conspecifics that harboured elevated levels of E. hormaechei, germ-depleted fifth-instar predator nymphs were fed equal amounts of either E. hormaechei-colonized prey or germ-depleted prey. Following feeding, predators were challenged by injection with P. mirabilis (300 nl, 104 CFU ml−1) or M. anisopliae (300 nl, 106 CFU ml−1), and survival was monitored at 12-h intervals, with 100–120 individuals per treatment.To assess how injury severity modulated immune defence and interacted with microbial protection, we inflicted abdominal wounds of graded size (0.4 mm (level 1) to 1.4 mm (level 6)) before pathogen exposure. P. mirabilis (200 nl, 104 CFU ml−1) or M. anisopliae (200 nl, 106 CFU ml−1) was inoculated directly at the wound site. Ten nymphs were housed per net cage (15 cm diameter, 17 cm height) as one biological replicate, with 6 replicates per treatment. Survival was quantified at 3 days for P. mirabilis and 5 days for M. anisopliae. For determination of the specific contribution of microbial guaiacol production to wound-size-dependent immunity, germ-depleted fourth-instar nymphs were colonized with either wild-type or vdc-mutant E. hormaechei before graded injury and pathogen challenge, with the same experimental design and survival end points.Pathogen load quantificationPathogen loads in locust haemolymph were quantified by qPCR for assessment of infection intensity under different experimental conditions. Haemolymph (100 μl) was collected from individual locusts, and genomic DNA was extracted using a FastPure Blood/Cell/Tissue/Bacteria DNA Isolation Mini Kit (Vazyme) according to the manufacturer’s instructions. qPCR was performed on a CFX96 Real-Time PCR System (Bio-Rad). Gene-specific primers targeting pathogen and locust reference genes are listed in Extended Data Table 3. Each qPCR reaction was carried out in a total volume of 20 μl, containing 2 μl of DNA template, 10 μl of Taq Pro Universal SYBR qPCR Master Mix (Vazyme, China), 0.8 μl of primer mix (10 μM each) and 7.2 μl of nuclease-free water. No-template controls were included in every run to enable monitoring of potential reagent contamination. Thermal cycling conditions consisted of an initial denaturation followed by 40 amplification cycles of 95 °C for 10 s, 55 °C or 60 °C for 30 s (depending on the primer set) and 72 °C for 20 s. We performed melting curve analysis at the end of each run to confirm amplification specificity. All qPCR assays were conducted with three technical replicates per sample.Absolute quantification of pathogen and host gene copy numbers was performed using standard curves generated from purified plasmid standards. PCR amplicons corresponding to each target gene were amplified with specific primers (Extended Data Table 3) and gel-purified using an EasyPure Quick Gel Extraction Kit (TransGen), cloned into a blunt-end vector and transformed into E. coli DH5α competent cells. Plasmids were extracted using a HiPure Plasmid EF Mini Kit (Magen) and quantified using a NanoDrop 1000 spectrophotometer. Five-fold serial dilutions of each plasmid standard, ranging from 2 ng μl−1 to 6.4 × 10⁻⁴ ng μl−1, were prepared and used to construct standard curves for calculation of gene copy numbers.Pathogen inhibition zone assayWe tested the antimicrobial activity of guaiacol using an inhibition zone assay to assess whether it directly inhibited pathogen growth. A guaiacol stock solution (5 × 10⁻², v/v) was prepared in absolute ethanol, with ethanol alone serving as the vehicle control. LB agar (for bacterial growth) and potato dextrose agar (for fungal growth) were prepared and sterilized by autoclaving. After the molten media had been cooled to approximately 70 °C, 200 μl of either guaiacol stock solution or absolute ethanol was added to 100 ml of molten medium, followed by gentle mixing, and the mixture was poured into plates.After the agar had solidified, P. mirabilis and M. anisopliae were inoculated individually at the centres of LB and potato dextrose agar plates, respectively. Plates were incubated at 30 °C under constant temperature conditions. Pathogen growth was quantified by measurement of colony diameters at 12 h for P. mirabilis and at 7 days for M. anisopliae; the different measurement times reflected the different growth rates of the bacterial and fungal pathogens.
E. hormaechei load quantificationTo determine whether E. hormaechei responded to host injury, we created artificial wounds on the abdomens of fourth-instar nymphs. Haemolymph was collected from the wound sites 2 h, 4 h, 6 h and 8 h after injury, with samples collected immediately after wounding serving as the 0-h control. For each biological replicate, 100 µl of haemolymph was collected from 20 individual locusts. Three biological replicates were performed. The collected haemolymph was used for DNA extraction and bacterial quantification.To assess whether E. hormaechei accumulated at wound sites, we again made artificial injuries on the abdomens of fourth-instar nymphs. Haemolymph was collected 6 h after injury from both the wound site and the uninjured pronotum of each locust. A total of 100 µl haemolymph from 20 locusts was pooled to form one biological replicate, and eight replicates were performed. Samples were then processed for DNA extraction and bacterial quantification as described (primer sequences are provided in Extended Data Table 3).Seven geographically distinct locust populations across China were collected, and the gut contents of the locusts were dissected for DNA extraction. For each biological replicate, 200 mg of gut contents were collected from about 15 individual locusts. Three biological replicates were performed. The collected gut contents were used for DNA extraction and bacterial quantification.Transcriptome sequencing and analysisTo determine whether guaiacol enhanced resistance to pathogenic microorganisms by activating the locust immune response, we performed transcriptome analyses on wound tissues under different treatment conditions. Germ-free locust nymphs were prepared, and standardized artificial wounds were inflicted on the abdomen. Wound sites were subsequently treated with either PBS (control) or guaiacol (10−4, v/v). Wound tissues were dissected and collected from both PBS- and guaiacol-exposed locusts at 3 h, 6 h and 9 h after treatment. For the subsequent infection assay, P. mirabilis (200 nl, 104 CFU ml−1) was inoculated at the wound site 3 h after initial guaiacol or PBS treatment. Wound tissues were collected from both PBS- and P. mirabilis-exposed locusts at 3 h after treatment.Total RNA was extracted from wound tissues using TRIzol reagent (Invitrogen). RNA quality and concentration were assessed using a NanoDrop spectrophotometer and an Agilent 2100 Bioanalyzer (Thermo Fisher Scientific). RNA sequencing libraries were constructed using a NEBNext Ultra RNA Library Prep Kit for Illumina (NEB) according to the manufacturer’s instructions. After quality inspection on an Agilent 2100 Bioanalyzer, qualified libraries were amplified using phi29 to generate DNA nanoballs, each containing more than 300 copies of a single DNA molecule. DNA nanoballs were loaded on to patterned nanoarrays, and paired-end reads of 100 bp were generated on the DNBSEQ sequencing platform.Raw sequencing reads were processed using SOAPnuke (v.1.4.0) for removal of adapter sequences and low-quality reads. Clean reads were then aligned to the reference genome using HISAT2 (v.2.0.4). Reference genome sequences and gene annotations were obtained from the corresponding genome database. For quantification of gene expression, clean reads were further aligned to the reference coding gene set using Bowtie2 (v.2.2.5), and transcript abundance was estimated using RSEM (v.1.2.12) and normalized as fragments per kilobase of transcript per million mapped reads.Differential gene expression analysis between guaiacol- and PBS-treated samples was performed using DESeq2 based on a negative binomial generalized linear model. Genes with an adjusted P value (Benjamini–Hochberg correction) less than or equal to 0.05 and an absolute Q value (adjusted P value) less than or equal to 0.05 were considered to be differentially expressed. Functional enrichment analysis of differentially expressed genes was conducted using the clusterProfiler R package (v.4.8.1), with correction for gene length bias. Kyoto Encyclopedia of Genes and Genomes (KEGG) pathways with corrected P RNAi experimentsTo evaluate the functional contribution of immune-related genes to pathogen resistance, we performed RNAi using gene-specific dsRNA. Total RNA was extracted from locusts using TRIzol reagent (Invitrogen), and first-strand cDNA was synthesized from 1 µg of total RNA using a HiScript III 1st Strand cDNA Synthesis Kit (Vazyme). Approximately 500-bp fragments of each target gene were amplified by PCR using gene-specific primers containing T7 promoter sequences (Extended Data Table 3). dsRNA was synthesized using the T7 RiboMAX Express RNAi System (Promega, USA), with dsRNA targeting GFP serving as a negative control.dsRNA was injected into fourth-instar nymphs using a WPI UMP3 microinjector. For assessment of knockdown efficiency, abdominal tissues excluding the gut were collected, and transcript levels were quantified by real-time qPCR. Ribosomal protein L32 (RPL32) and β-actin were used as internal reference genes. Each real-time qPCR reaction was performed in a total volume of 20 µl, containing 2 µl of template cDNA, 10 µl of Taq Pro Universal SYBR qPCR Master Mix (Vazyme, China), 0.8 µl of primer mix (10 µM) and 7.2 µl of nuclease-free water. Amplification was carried out for 40 cycles under the following conditions: 95 °C for 10 s, 55 °C or 60 °C for 30 s, and 72 °C for 20 s. Three technical replicates were performed for each sample. No-template controls were included in each run, and melting curve analysis was conducted to confirm amplification specificity. Relative gene expression levels were calculated using the 2−ΔΔCt method.After confirming effective gene knockdown, we injected dsRNA into a separate cohort of fourth-instar nymphs (n = 80 to n = 100), which were subsequently subjected to pathogen infection assays. Survival rates of dsRNA-treated and control nymphs were recorded to determine the contribution of the targeted genes to resistance against pathogen infection.Locust mobility performance bioassayTo assess whether injury severity affected prey mobility in predation assays, we quantified the locomotor performance of prey nymphs with graded injury levels (levels 1–6). Injured prey nymphs were individually introduced into a well-ventilated arena (56 cm × 28 cm × 18 cm), and their movement trajectories were recorded using a high-definition camera under standardized conditions. Recorded videos were subsequently analysed using EthoVision XT 18.0 software for quantification of total movement distance and average movement speed for each injury level.Statistics and figure preparationAll statistical analyses were performed using SPSS 26.0. Statistical analyses were conducted using one-way ANOVA followed by Tukey’s post hoc test, one-sample Wilcoxon signed-rank test or two-tailed unpaired Student’s t-tests. Preliminary figures were constructed using software Origin 2018 (https://www.originlab.com/), curves were fitted with GraphPad Prism 9.0 and figures were drawn using Adobe Illustrator 2025.Reporting summaryFurther information on research design is available in the Nature Portfolio Reporting Summary linked to this article.