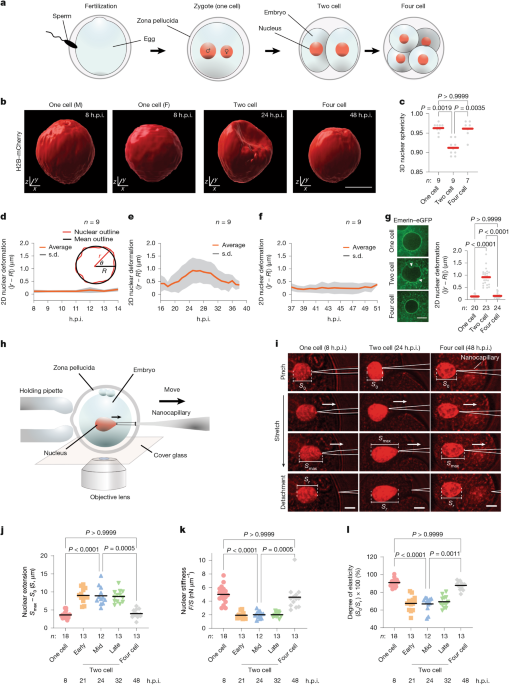
AnimalsMice (ICR and B6C3F1/Jc1 or slc (BCF1)) aged 5–15 weeks53 were purchased from CLEA Japan, Japan SLC or Kiwa Laboratory Animals, maintained in light-controlled (light: 08:00 to 20:00; dark: 20:00 to 08:00), air-conditioned rooms (ambient temperature: 23 °C ± 1.5 °C, humidity: 50 ± 10%) at each facility and used for experiments. All mice were euthanized by cervical dislocation and all efforts were made to minimize suffering and to reduce the number of animals used.IVFTo obtain oocytes, female mice were superovulated by intraperitoneal injections of 7.5 IU of pregnant mare serum gonadotropin (PMSG; ASKA Animal Health), followed by 7.5 IU of human chorionic gonadotropin (hCG; ASKA Animal Health) at 48 h after PMSG injection. After the female mice were euthanized at 15–16 h after hCG injection, oocytes were collected from the oviducts by an abdominal operation and transferred to a pre-heated medium of Human Tubal Fluid (HTF; ARK Resource). Sperm were collected from the caudal epididymis of male mice for in vitro fertilization (IVF). For fertilization, freshly prepared or cryopreserved sperm were incubated in HTF medium for 1–1.5 h at 37 °C and 5% CO2 to allow for capacitation. Subsequently, the sperm suspension was mixed with the medium containing the oocytes, and fertilized eggs were collected 1–2 h after insemination followed by removal of cumulus cells with 0.1% hyaluronidase. The eggs were then transferred to drops of preheated KSOM medium (ARK Resource) and cultured at 37 °C in air containing 5% CO2.SCNTSomatic cell nuclear transfer (SCNT) was performed as described previously54. In brief, enucleation of cumulus-free MII oocytes was performed in drops of CZB medium including 5 μg ml−1 cytochalasin B. One donor cumulus cell in CZB medium with 6% deionized-BSA was transferred to the perivitelline space of an enucleated oocyte together with a small amount of HVJ-E (GenomeONE-CF; Ishihara Sangyo) by tightly attaching the donor cell to the enucleated oocyte. The oocyte was then cultured in KSOM medium for 1 h at 37 °C in air containing 5% CO2 for the cell fusion. The reconstructed oocytes were activated in KSOM medium containing 5 mM SrCl2, 2 mM EGTA and 5 μg ml−1 cytochalasin B (Sigma-Aldrich) for 6 h at 37 °C in air containing 5% CO2. The activated SCNT embryos were cultured at 37 °C in air containing 5% CO2 in KSOM medium.Inhibitor treatmentPharmacological inhibition experiments were performed by treating embryos with the following chemicals in KSOM medium containing 0.5% (v/v) DMSO: 10 µM wortmannin (19545-26-7, AdipoGen); and 200 nM bafilomycin A1 (SML1661, Sigma-Aldrich). Wortmannin treatment was started at 12 h.p.i. and terminated before fixation at 32 h.p.i. Bafilomycin treatment was started at 15 h.p.i. and terminated before fixation at 28 h.p.i. The mock control also contained 0.5% (v/v) DMSO throughout assays.AntibodiesFor immunoblotting assays, the following antibodies were used: anti-p62 rabbit IgG (PM045MS, MBL), anti-β actin mouse mAb (AC-15, Santa Cruz), anti-GFP chicken IgY (ab13970, Abcam), HRP-conjugated goat anti-rabbit IgG antibody (32460, Thermo Fisher Scientific), HRP-conjugated rabbit anti-mouse IgG antibody (61-6520, Thermo Fisher Scientific), HRP-conjugated goat anti-chicken IgY-HRP (A16054, Thermo Fisher Scientific), anti-lamin B1 mouse IgG (sc-374015, Santa Cruz), anti-HA antibody (51064-2-AP, Proteintech) and HRP-conjugated anti-rabbit IgG antibody (32460, Thermo Fisher Scientific). For immunostaining imaging assays, the following antibodies were used: anti-lamin A/C mouse IgG2a (39287, Active Motif), anti-lamin A/C mouse IgG1k (sc-376248, Santa Cruz), anti-lamin B1 mouse IgG (sc-374015, Santa Cruz; amino acids 559–586 of lamin B1), anti-lamin B1 rabbit IgG (ab16048, Abcam), anti-lamin B2 rabbit IgG (ab151735, Abcam), anti-lamin B2 mouse IgG1 (68475-1-Ig, Proteintech), anti-RNA polymerase II phosphorylated at serine 2 mouse IgM (920203, BioLegend), anti-phospho-histone H2A.X (Ser139) mouse IgG1 (05-636, Sigma-Aldrich), anti-LAP2Β mouse IgG (611000, BD Transduction Laboratories), anti-BrdU mouse IgG1 (sc-32323, Santa Cruz), goat anti-mouse IgG (H+L) Alexa Fluor 488 (A11001, Thermo Fisher Scientific), goat anti-mouse IgG (H+L) Alexa Fluor 568 (ab175473, Abcam), goat anti-mouse IgG (H+L) Alexa Fluor 647 (ab150115, Abcam), goat anti-rabbit IgG (H+L) Alexa Fluor 488 (A11008, Thermo Fisher Scientific), Alexa Fluor 594-labelled donkey anti-rabbit IgG antibody (A21207, Thermo Fisher Scientific), and goat anti-mouse IgM (Heavy chain) Alexa Fluor 594 (A21044, Thermo Fisher Scientific). For antibody microinjection experiments, the following antibodies were used: anti-LC3 mouse IgG (CTB-LC3-2-IC, Cosmo Bio) and normal mouse IgG (sc-2025, Santa Cruz).PlasmidspcDNA-emerin-eGFP-polyA was a gift from Y. Zhang (Addgene, 59747)55. pcDNA-nesprin-TS was a gift from D. Conway (Addgene, 68127)56. pcDNA3.1-H2B-mCherry-polyA, pcDNA3.1-H2B-EGFP-polyA and pcDNA3.1-EGFP-polyA were gifts from K. Yamagata. pcDNA-emerin-eGFP-polyA was used to label the nuclear envelope. pcDNA3.1-EGFP-polyA was used as a backbone or an expression control, while pcDNA3.1-H2B-mCherry-polyA and pcDNA-H2B-EGFP-polyA were used as nuclear markers. Moreover, custom constructs generated in this study for live-embryo imaging and overexpression assays are as follows: pcDNA3.1-sfLB1-polyA, pcDNA3.1-sfLB1Δ-polyA, pcDNA3.1-eGFP-sfLB1-polyA, pcDNA3.1-mEGFP-sfLB1Δ-polyA, pcDNA3.1-eGFP-LC3-polyA, pcDNA3.1-mEGFP-flLB1wt-polyA, pcDNA3.1-mCherry-flLB1wt-polyA, pcDNA3.1-mCherry-flLB1(5A)-polyA, pcDNA3.1-mCherry-flLB1(F454A/F457A)-polyA, pcDNA3.1-mCherry-flLB1(S24A)-polyA, pcDNA3.1-mCherry-flLB1(F454A/F457A)ΔC-polyA, pcDNA3.1-mCherry-NLS-polyA, pcDNA3.1-mEGFP-KASH-TM-polyA, pcDNA3.1-LaG16-titin-LaG16-mCherry-polyA, pcDNA3.1-LaG16(5A)-titin-LaG16(5A)-mCherry-polyA and pcDNA3.1-LaG16-titin(W34E)-LaG16-mCherry-polyA. For generating each of the WT constructs, the corresponding genetic sequences were amplified by PCR from mouse ovary cDNA, which was synthesized using SuperScript VILO Master Mix (11756050, Thermo Fisher Scientific) with the following primer pairs: flLB1_fp1 and flLB1_rp1 for lamin B1 and LC3_fp1 and LC3_rp1 for LC3 (sequence information is provided below). Amplified fragments were cloned either into downstream of eGFP in the pcDNA3.1-eGFP-polyA vector to create fusion constructs, or used to replace its eGFP sequence. All cloning procedures were performed using the In-Fusion cloning system (Clontech) unless otherwise noted. For mCherry fusion constructs, the eGFP sequence was replaced with mCherry, and a codon-optimized linker sequence (SGLRSRAQA)57 was inserted in between. The plasmids for full-length lamin B1 mutants were generated by introducing substitutional mutations into pcDNA3.1-mCherry-flLB1wt-polyA using the following primer pairs: flLB1_fp2 and flLB1_rp2, flLB1_fp3 and flLB1_rp3, and flLB1_fp4 and flLB1_rp4, for flLB1(5A), flLB1(F454A/L457A) and flLB1(S24A), respectively. For flLB1(F454A/L457A)ΔC, the corresponding CaaX sequence was removed using flLB1_fp5 and flLB1_rp5 followed by ligation. The plasmids carrying sfLB1 were generated by amplifying the corresponding coding sequence (371–459) from the lamin B1 plasmid using the following PCR primers: sfLB1_fp1 and sfLB1_rp1, sfLB1_fp2 and sfLB1_rp2, sfLB1_fp3 and sfLB1_rp3, and sfLB1_fp4 and sfLB1_rp4, and inserting them into a pcDNA3.1 vector. A codon-optimized linker sequence (RDPPVAT) was inserted between eGFP and sfLB1. pDHFR-3HA-LB1, pDHFR-3HA-LB1Δ, pDHFR-3HA-LB1(5A) and pDHFR-3HA-LB1(F454A/L457A) for pull-down assays were generated by cloning out the corresponding coding sequence from the full-length lamin B1 plasmids and inserted them into the DHFR vector (New England Biolabs). For GST-LC3, the coding sequence of LC3 was inserted into a pGEX vector downstream of GST and the PreScission sequence. pcDNA3.1-mCherry-NLS-polyA for nuclear imaging was generated by inserting a codon-optimized SV40 large T antigen NLS downstream of mCherry in pcDNA3.1-mCherry-flLB1-polyA (inverse PCR primers: NLS_fp1 and NLS_rp1). To generate pcDNA3.1-mEGFP-KASH-TM-polyA for nuclear envelope tethering, the KASH-TM sequence (amino acids 6525–6874 of nesprin 2G) was amplified by PCR from the pcDNA nesprin TS vector (Addgene, 68127, gift from D. Conway) using primers KASH-TM_fp1 and KASH-TM_rp1. The amplified fragment was then inserted into a pcDNA3.1-mEGFP vector. pcDNA3.1-LaG16-titin-LaG16-mCherry-polyA was generated as a fusion of titin immunoglobulin domain (I27(V11P))31 flanked by a pair of GFP-nanobody (LaG16)58. First, the coding sequences of LaG16 and I27(V11P) codon-optimized for mouse were synthesized by Eurofins Genetics. The first LaG16, I27(V11P), and the second LaG16 comprising the tether were each amplified by PCR using primer pairs LaG16_fp1 and LaG16_rp1, Titin_fp1 and Titin_rp1, and LaG16_fp2 and LaG16_rp2, respectively, and then inserted in order into a pcDNA3.1-mCherry vector using restriction enzyme digestion (ClaI and HpaI) and sticky/blunt-end ligation with a Ligation Mix kit (6023, Takara). Codon-optimized linker sequences (GGGGS and RDPPVAT) were inserted between the first LaG16 and titin I27 and between the second LaG16 and mCherry, respectively. The DNA fragment of LaG16 mutant (S32A/T56A/V57A/R103A/V106A), designed according to a previous study59, was also synthesized by Eurofins Genetics and used to generate the plasmid in the same way as above. The mutation in titin (W34E)60 was introduced using the primers Titin_W34E_fp1&rp1. All the plasmids were verified by DNA sequencing (Eurofins Genetics).The primers used were as follows: sfLB1_fp1 (5′-TGGTGGAATTCGCCACCATGCTGGACATGGAGATCAGC-3′); sfLB1_rp1 (5′-CATAGTCGAGCGGCCGCTCAGTTCTTCAAGCGAATAAACTTCCCATC-3′); sfLB1_fp2 (5′-TGGTGGAATTCGCCACCATGCTCTCTCCAAGCCCTTCTTCCC-3′); sfLB1_rp2 (5′-GCCCATAGTCGAGCGGCCGCTCAGGCTGAGGCAGAGTGGGA A-3′); sfLB1_fp3 (5′-GGGATCCACCGGTCGCCACCATGCTGGACATGGAGATCAG-3′); sfLB1_rp3 (5′-CATAGTCGAGCGGCCGCTCAGTTCTTCAAGCGAATAAACTTCCCATC-3′); sfLB1_fp4 (5′-ATCCACCGGTCGCCACCATGCTCTCTCCAAGC-3′); sfLB1_rp4 (5′-GCCCATAGTCGAGCGGCCGCTCAGGCTGAGGCAGAGTGGGA A-3′); LC3_fp1 (5′-CGGCCTGAGAAGCAGAATGCCGTCCGAGAAGACC-3′); LC3_rp1 (5′-GCCCATAGTCGAGCGGCCGCTTACACAGCCATTGCTGTCCCG-3′); flLB1_fp1 (5′-ACTCAGATCTCGAGCTCAAGCTTCGATGGCGACCGCGAC-3′); flLB1_rp1 (5′-GCCCATAGTCGAGCGGCCGCTCACATAATGGCACAGCTTTTATTGGATG-3′); flLB1_fp2 (5′-CAGCCCCTGCCGCCGCCGCCACCGTGTCCAGAGCGTCC-3′); flLB1_rp2 (5′-GGCGGCGGCGGCAGGGGCTGGAGAGAGCTTTAACCGCTCTTC-3′); flLB1_fp3 (5′-GGCTATTCGCGCGAAGAACACTTCTGAGCAGG-3′); flLB1_rp3 (5′-CGCGCGAATAGCCTTCCCATCAACATCTATCTCT-3′); flLB1_fp4 (5′-ACGCCGCTCGCCCCCACGCGCCTGTCGC-3′); flLB1_rp4 (5′-GCGCGTGGGGGCGAGCGGCGTGGCGGG-3′); flLB1_fp5 (5′-GCGGCCGCTCGACTATG-3′); flLB1_rp5 (5′-CCATAGTCGAGCGGCCGCTCAGCTTTTATTGGATGCTCT-3′); NLS_fp1 (5′-GGGCCGCCTAAGAAAAAGCG-3′); NLS_rp1 (5′-CGCTTTTTCTTAGGCGGCCCCTTGTACAGCTCGTCCATGCC-3′); KASH-TM_fp1 (5′-GATCTCGAGCTCAAGCTTCGCAGGAGCTTCACAGCAAGCT-3′); KASH-TM_rp1 (5′-GCCCATAGTCGAGCGGCCGCCTAGGTGGGAGGTGGCCC-3′); LaG16_fp1 (5′-GTGTGGTGGAATTCGCCACCATGGCACAAGTG-3′); LaG16_rp1 (5′-CCCATCGATGGACACAGTCACTTGTGTTCC-3′); LaG16_fp2 (5′-TGGCTCTGTTAACATGGCACAAGTGCAGCTG-3′); LaG16_rp2 (5′-CCGTTAACGGACACAGTCACTTGTGTTCC-3′); Titin_fp1 (5′-GTGTCCATCGATGGGGGCGGGGGCTCTCTGATCGAGGTGGAGAAGC-3′); Titin_rp1 (5′-AGAGCCACCTCCCCCCAGCTCCTTCACCTTCAG-3′); Titin_W34E_fp1 (5′-CAGGAGAAGCTGAAGGGCCAGC-3′); Titin_W34E_rp1 (5′-CTTCTCCTGGCCGTGCACGT-3′).mRNA microinjectionAfter insemination, fertilized embryos were collected at 12–14 h.p.i. and subjected to mRNA injection unless otherwise noted. Cumulus-free embryos were transferred to drops of M2 medium (ARK Resource) and mRNAs were injected using a piezo manipulator (Prime Tech). The final concentrations of injected mRNA were as follows: 500 ng μl−1 of sfLB1, 500 ng μl−1 of sfLB1Δ, 350 ng μl−1 of flLB1(5A), 350 ng μl−1 of flLB1(F454A/L457A), 350 ng μl−1 of flLB1(F454A/L457A)ΔC, 20 ng µl−1 of mCherry-NLS, 100 ng µl−1 of eGFP-LC3 or eGFP, 300 ng μl−1 of mEGFP-KASH-TM, 125 ng μl−1 of LaG16-titin-LaG16-mCherry (WT, LaG16(5A) and titin(W34E), respectively). In some experiments, mRNA of eGFP (25 ng μl−1) or histone H2B-eGFP (20 ng μl−1) were co-injected to confirm successful injection or to visualize nuclei. After mRNA injection, embryos were cultured in KSOM medium at 37 °C in air containing 5% CO2. For assays with flLB1, flLB1(5A) and flLB1(F454A/L457A), post-injected embryos were inspected at 24 h.p.i. using a fluorescence microscope and those displaying collapsed nuclei were excluded from analyses. mRNAs synthesis was performed using mMESSAGE mMACHINE T7 Transcription Kit (AM1344, Thermo Fisher Scientific) after linearization of plasmid vectors by restriction enzyme digestion. The synthesized mRNAs were purified using the RNeasy Plus Mini Kit (74034, Qiagen) and subjected to agarose gel electrophoresis and spectrophotometry to verify the purity (criteria: optical density at 260 nm/280 nm ratio of >2.0). The purified mRNAs were flash frozen in liquid nitrogen, stored at –80 °C and used within 6 months.Antibody microinjectionFertilized embryos were collected at 12–14 h.p.i. and subjected to injection of the following antibodies in M2 medium (ARK Resource): anti-LC3 mouse IgG (100 µg ml−1); normal mouse IgG (100 µg ml−1). After the antibody injection, the embryos were cultured in KSOM medium until 24 h.p.i. and then analysed.Preimplantation embryonic developmentAfter mRNA injection, embryos were cultured in KSOM medium at 37 °C in air containing 5% CO2. The developmental stages of the embryos were monitored at 24, 48, 72 and 96 h.p.i. The frequency of development to the blastocyst stage for non-injected embryos at 96 h.p.i. was 85.5 ± 7.6% (mean ± s.d. among five biological replicates).Live-embryo imagingLive-embryo imaging was performed using an inverted fluorescence microscope (Ti-U, Nikon) equipped with a motorized sample stage (MS-2000, Applied Scientific Instruments), a piezo-driven objective scanner (PIFOC, Physics Instruments) with a piezo controller (E-665, Physics Instruments), a stage-top incubator (TIZ, Tokai Hit), a spinning-disk confocal unit (CSU-X1, Yokogawa) with two excitation lasers (488 nm and 561 nm; OBIS LS, Coherent), a silicone-immersion objective lens (UPlanSApo ×60/1.30 NA, Olympus) and a sCMOS camera (Neo4.1, Andor). After injection of mRNA, embryos were placed in drops of KSOM medium (10 µl each), which was supplemented with 0.00025% (w/v) polyvinyl alcohol (PVA; P8136-250G, Sigma-Aldrich) and placed onto a glass-bottom culture dish (P35G-1.5-14-C, MatTek) filled with paraffin oil (26137-85, Nacalai Tesque). The embryos were maintained in a cell culture incubator at 37 °C and 5% CO2 before being transferred to the microscope’s stage-top incubator, which was pre-conditioned at 37 °C and filled with humidified air containing 5% CO2. For acquisition of long-term timelapse data (Fig. 1), fertilized embryos were injected with mRNA (20 ng µl−1 of histone H2B-mCherry) at 1–2 h.p.i. and imaging was started at 8 h.p.i. Optical sections were acquired across individual nuclei (step size: 5 µm; total scan width: 60 µm) at 1 h intervals. Imaging with emerin–eGFP and mCherry–NLS (300 ng µl−1 and 20 ng µl−1 mRNA, respectively) was performed in the same manner but at 8, 24 and 48 h.p.i. The exposure of embryos to the excitation lasers was minimized by shuttering the illumination using image acquisition software (NIS elements v.5.0, Nikon) (exposure time, 200 ms). The laser power at the objective’s focus was set to 0.3 mW and 50 mW for the imaging of H2B–mCherry and emerin–eGFP, respectively. For acquisition of timelapse data with flLB1 constructs (Fig. 3), embryos were injected with mRNA (20 ng µl−1 of mCherry-flLB1 or 20 ng µl−1 of mCherry-flLB1 mutants) at 12–14 h.p.i. and the imaging was started at 21 h.p.i. (interval, 1 h; laser power, 9 mW). Under these conditions, the development of embryos to the blastocyst stage was 80.7 ± 3.9% (n = 4–11 embryos per preparation; versus 83.6% for non-injected embryos cultured in an incubator, n = 55 embryos). For lysosome imaging, embryos were incubated in KSOM medium containing LysoPrime Green (1:2,000, 345-09903, Dojindo) for 1 h, followed by washing with KSOM before acquisition of confocal slices at 1 µm intervals. Photobleaching was negligible as varying the exposure time or imaging time intervals did not significantly affect the observed dynamics. For the analysis of the first cleavage events (Extended Data Fig. 9g,h), embryos at 12–14 h.p.i. were injected with mRNA (20 ng μl−1 of histone H2B-mCherry) for nuclear visualization and subjected to timelapse imaging at 30 min intervals, starting at 15 h.p.i. (objective lens: Plan Apo ×20/0.75 NA, Nikon, z-step size: 2 µm; total scan width, 40 µm).IF imagingIVF embryos were fixed in 4% PFA/PBS at room temperature for 20 min. Fixation was started at 8 h.p.i. for one-cell, 21 h.p.i. for early-two-cell, 24 h.p.i. for mid-two-cell, 32 h.p.i. for late-two-cell, and 48 h.p.i. for four-cell embryos. The fixed embryos were washed three times with 0.01% PVA/PBS. To quantitatively compare lamin signals among embryos at different developmental stages, embryos of all stages were simultaneously treated for the following immunofluorescence (IF) steps and observed by a confocal microscope under the same conditions. The samples were permeabilized with 0.5% Triton X-100 (T8787, Sigma-Aldrich)/PBS at room temperature for 20 min, followed by incubation three times with 3% BSA/PBS for 10 min each at room temperature. The samples were then incubated with primary antibodies (anti-Lamin B1 mouse IgG, 1:100, sc-374015, Santa Cruz; anti-lamin B2 rabbit IgG, 1:100, ab151735, Abcam; anti-lamin B2 mouse IgG1, 1:100, 68475-1-Ig, Proteintech; anti-Lamin A/C mouse IgG, 1:200, 39087, Active Motif; anti-lamin A/C mouse IgG1k, 1:100, sc-376248, Santa Cruz; and anti-Lap2β mouse IgG, 1:100, 611000, BD Transduction Laboratories) at 4 °C overnight. After three washes with 3% BSA/PBS, the samples were further incubated in the dark with goat anti-mouse IgG (H+L) cross-adsorbed secondary antibody, Alexa Fluor 488 (1:2,000; A11001, Thermo Fisher Scientific), goat anti-rabbit IgG (H+L) cross-adsorbed secondary antibody, Alexa Fluor 488 (1:2,000; A11008, Thermo Fisher Scientific), Alexa Fluor 594-labelled donkey anti-rabbit IgG antibody (1:2,000; A21207, Thermo Fisher Scientific), goat anti-mouse IgG (H+L) cross-adsorbed secondary antibody, Alexa Fluor 568 (1:2,000; ab175473, Abcam) and goat anti-mouse IgG (H+L) cross-adsorbed secondary antibody Alexa Fluor 647 (1:2,000; ab150115, Abcam) at room temperature for 1 h. For DNA damage assay, the embryos were fixed at 34 h.p.i. and were immunostained with anti-phospho-histone H2A.X (Ser139) mouse IgG1 (1:250; 05-636, Sigma-Aldrich) followed by Alexa 488-labelled anti-mouse IgG (H+L) (1:500, A11001, Thermo Fisher Scientific) using the same protocol as above. The samples were washed three times with 3% BSA/PBS and then mounted onto slides using VECTASHIELD mounting medium containing DAPI. Fluorescence signals were observed using the LSM800 microscope (Zeiss), equipped with a laser module (405/488/561/640 nm) and GaAsP detector, using the same contrast, brightness and exposure settings across each set of experiments. z-slice thickness was determined using the optimal interval function in ZEN software. The fluorescence signals of phospho-histone H2A.X were observed using a Nikon microscope equipped with a mercury vapour lamp (Nikon, C-HGFI Intensilight) and GFP and DAPI filters. For 3D nuclear imaging with RNA pol II, embryos were immunostained with anti-RNA polymerase II phosphorylated at serine 2 mouse IgM (1:100, 920203, BioLegend) followed by Alexa 568-labelled anti-mouse IgG (H+L) (1:2,000; ab175473, Abcam) using the same protocol as above and then stained with 1 µM SYTOX Green nucleic acid stain (S7020, Thermo Fisher Scientific) for 30 min. The embryos were then placed into a glass-bottom dish containing VECTASHIELD (H-1000, VEC) without coverslip mounting to minimize sample compression. The confocal slices were acquired at 1-µm steps using the spinning-disc confocal Nikon microscope above.Uridine incorporation assayRNA synthesis was measured by EU incorporation. The embryos that were microinjected with mRNA and remained viable at 15 h.p.i. were incubated in KSOM medium containing 2 mM EU (C10329, Thermo Fisher Scientific) from 15 h.p.i. The embryos were fixed at 28 h.p.i. and permeabilized according to the above immunostaining protocol, and then the incorporated EU was detected using Click-iT RNA Alexa Fluor 488 Imaging Kit according to the manufacturer’s protocol (C10329, Thermo Fisher Scientific). Alexa Fluor 647 azide (A10277, Thermo Fisher Scientific) was used at a concentration of 25 µM. The samples were mounted onto the slides using VECTASHIELD Mounting Medium containing DAPI. The fluorescence signals were observed using an LSM900 microscope (ZEISS).Deoxyuridine incorporation assayCell cycle progression was examined by 5-ethynyl-2±-deoxyuridine (EdU) or 5-bromo-2′-deoxyuridine (BrdU) incorporation. For autophagy inhibition experiments, embryos were cultured in KSOM medium containing 10 µM wortmannin (DMSO as a vehicle control) during 12–22 h.p.i. As a positive control, the embryos were cultured in KSOM medium containing 3 µg ml−1 aphidicolin (A0781-1MG, Sigma-Aldrich) during 18–22 h.p.i.; these timings were determined based on a previous publication61. The embryos were then cultured in KSOM medium containing 10 µM EdU with wortmannin, DMSO or aphidicolin during 22–24 h.p.i. These EdU-treated embryos were fixed with 4% paraformaldehyde in PBS for 20 min, and then permeabilized with 0.5% Triton X-100 in PBS for 20 min at room temperature. After permeabilization, the embryos were washed and incubated in the Click-iT reaction cocktail for 30 min according to the manufacturer’s instructions (Thermo Fisher Scientific, C10637). After the wash steps, the samples were mounted on glass slides in VECTASHIELD mounting medium containing DAPI. The fluorescence signals were observed using a confocal microscope (LSM800, Carl Zeiss), equipped with a laser module (405/488/561/640 nm) and GaAsP detector. BrdU incorporation assays were performed as above except for the use of 100 µM instead of 10 µM, a 10 min treatment with 4 N HCl (37313-25, Nacalai Tesque) followed by neutralization in 100 mM Tris-HCl solution (pH 8.0) after permeabilization and staining with anti-BrdU antibody (1:100; sc-32323, Santa Cruz) at 4 °C overnight followed by goat anti-mouse IgG (H+L) Alexa Fluor 647 (1:1,000; ab150115, Abcam) at room temperature for 1 h along with DNA counterstain with Hoechst 33342 (1:1,000; C10637, Thermo Fisher Scientific).Mechanical measurementThe mechanical properties of nuclei at each cleavage stage in living embryos were measured using single glass nanocapillaries, which were held with a three-axis, low-drift hydraulic micromanipulator (MHW-3, Narishige) attached to the microscope’s body. The nanocapillaries were prepared by fabricating borosilicate glass tubes (B100-75-10, Sutter Instruments) using a capillary puller (PD-10, Narishige) such that the tip formed a nearly uniform taper with an inner diameter of around 1 μm (1.06 ± 0.02 µm, n = 5). To begin with, embryos injected with mRNAs (20 ng µl−1 of H2B-mCherry or 300 ng µl−1 of emerin-eGFP) were transferred to drops of M2 medium, which was placed in a glass-bottom, open-top culture chamber covered with paraffin oil (26137-85, Nacalai Tesque). The chamber was then placed onto the microscope’s sample stage and a single embryo was captured by using a large holding pipette (inner diameter, ~10 µm), which approached from one side of the embryo. A nanocapillary was then inserted from the opposite side of the embryo and its tip was contacted to the nuclear surface; the nucleus was then captured at its surface by applying a weak suction pressure to the nanocapillary. The level of the suction pressure was controlled using a syringe pump (PHD ULTRA, Harvard apparatus) and a digital manometer (PPA101-M, SMC), which were connected to the distal end of the nanocapillary through a vacuum tube. The pressure level (1.2–2.1 × 101 kPa) was such that the nuclear surface could sustain its attachment to the nanocapillary tip but could not be aspirated. Finally, the nucleus was stretched by moving the nanocapillary position away from the embryo’s centre at a velocity with which the viscous resistance from the cytoplasm could be low. At a typical movement speed of 0.25 µm s−1, the viscous resistance on the nucleus as estimated according to the Stokes–Einstein equation62 was 0.05–0.16 nN (see the ‘Image analyses’ section). This value was over 100 times smaller than the force generated at the nanocapillary tip (~17 nN), as estimated from the product of the applied pressure and the nanocapillary’s aperture size (0.8 ± 0.1 µm2; nanocapillary aperture size = π(d/2)2, where d is the nanocapillary’s inner diameter; n = 5). Internal nuclear pressure was disregarded as different nanocapillary pressure levels yielded similar results. Associated with the nanocapillary’s movement, the nucleus gradually deformed and then detached from the nanocapillary before reaching the embryo’s edge. The extent of the maximal extension that nuclei had exhibited was used to determine effective nuclear stiffness. The measurement was performed for nuclei at the one-cell, two-cell and four-cell stages using approximately the same micromanipulation parameters (that is, pressure level, nanocapillary size and nanocapillary movement speed). Embryos of which nuclei were properly captured, as assessed by (1) a sealed contact surface with no aspiration of nuclear material and (2) translocation of the nuclear surface in response to nanocapillary movement, were subjected to subsequent analyses. Individual nuclei were not subjected to repeated measurements. Where feasible, the order of the measurement for control and treatment groups was randomized. The measurements were highly consistent across experiments (mean two-cell nuclear stiffness of non-injected controls: 2.07 ± 0.20 nN µm−1, mean ± s.d., across four independent experiments). These control data were pooled across experiments and used as a reference, mitigating the limitation in the number of samples that could be analysed within the narrow time window per experiment (1 − 2 h for each developmental stage). The label-free measurement (Extended Data Fig. 2h) was performed using differential interference contrast (DIC) microscopy. For the analysis of nuclear stiffness and embryonic development (Fig. 2 and Extended Data Fig. 3), the above-described micromanipulation procedure was used but with a pressure level of 1.2 × 101 kPa.The mechanical properties of nuclei were also examined using an alternative micromanipulation technique (Extended Data. Fig. 2l–n), which was based on glass capillaries but eliminated of the nuclear translocation within the cytoplasm. This was achieved by using the same microscopy setup as above but with capillaries of wider bore size (inner diameter, 2.09 ± 0.12 µm, n = 13). Moreover, the pressure level was increased linearly instead of being maintained constant, such that the tension above which the nuclear periphery was aspirated inside a glass capillary could be measured. Specifically, after the physical contact of the capillary tip with the nuclear surface, the suction pressure was raised at a constant rate of 6 × 10³ Pa min−1. The capillary’s position was fixed throughout this procedure. The nucleus could withstand the applied aspiration pressure and maintain its overall shape until it yielded to the pressure. The pressure level was constantly monitored using a digital manometer (Testo 521, Testo) and the value at which the nuclear surface started to be aspirated inside the capillary (>1 µm displacement from the tip) was determined by examining the fluorescence image acquired simultaneously. The measurements were performed at 22 ± 1 °C and completed within 60 min, over which no noticeable change in the nuclear mechanics was observed. The objective lens of ×40 (Plan Apo, 0.95 NA; Nikon) was used for the imaging.Western blottingp62 and lamin B1 were immunoblotted on embryonic lysates. For p62 and lamin B1 blotting of eGFP−sfLB1, embryos were first injected with mRNA (500 ng µl−1 of the eGFP-sfLB1 and mEGFP–sfLB1Δ as a negative control) at 12–14 h.p.i. and then collected at the two-cell stage (at 24 h.p.i. and 32 h.p.i. for eGFP–sfLB1). Before lysis, the zona pellucida was removed by acidified Tyrode’s (T1788, Sigma-Aldrich) and washed three times in PBS containing 0.01% PVA. Sixty embryos were then soaked with Tris-glycine SDS sample buffer (LC2676, Novex) containing 2-mercaptoethanol (161-0710, Bio-Rad) and 500 ng BSA (Albumin Standard, 23209, Thermo Fisher Scientific) as a loading control and heated at 90 °C for 5 min. For lamin B1 blotting, 34 IVF embryos were collected at 21 and 32 h.p.i. and lysed in SDS sample buffer (Wako). The lysis was done by heating at 90 °C for 3 min. Proteins were separated on 10% or 5–20% (80-12-278, Bioimprove) polyacrylamide gel or e-PAGEL HR (5-20%) gel (HER-T520L, ATTO) and then transferred to PVDF membrane (1704272, Bio-Rad) using Transblot SD (Bio-Rad) or a Trans Blot-Turbo transfer system (1704150J1, Bio-Rad). After blocking with 3% BSA-containing PBS with 0.2% Tween-20 or SuperBlock blocking buffer (37535, Thermo Fisher Scientific) with 0.05% Tween-20 (161-0781, Bio-Rad), the membrane was blotted sequentially with the following primary antibodies: anti-lamin B1(B-10) mouse IgG (1:1,000, sc-374015, Santa Cruz) or anti-p62 rabbit IgG (1:1,000, PM045MS, MBL), anti-actin rabbit IgG (1:1,000, A2066, Merck), anti-GFP chicken IgY (1:5,000, ab13970, Abcam; for p62 assays). Each blotting was carried out overnight at 4 °C, followed by 1 h staining with the secondary antibody at room temperature; HRP-conjugated goat anti-rabbit IgG antibody (1:3,000, 32460, Thermo Fisher Scientific), HRP-conjugated goat anti-mouse IgG antibody (1:5,000, 32430, Thermo Fisher Scientific) and HRP-conjugated goat anti-chicken IgY-HRP (1:5,000, A16054, Thermo Fisher Scientific). The membrane was stripped off using Restore western blot stripping buffer (21059, Thermo Fisher Scientific) after each blot. For p62 blotting, the membrane was pre-stained with Ponceau S (P7170, Sigma-Aldrich) and then washed with TBST after image acquisition. Blotting was performed using the ECL Prime Western Blotting System (Amersham, RPN2232), SuperSignal West Femto or West Dura (34094 and 34075, Thermo Fisher Scientific) according to the manufacturer’s protocols. Images were acquired using the Gel Doc ZE imager (Bio-Rad) or ChemiDoc MP (Bio-Rad).Pull-down assaySamples were prepared through the bacterial expression of GST-tagged LC3 (GST–LC3) and HA-tagged lamin B1 fragment (HA–LB1). For GST–LC3 expression, E. coli Rosetta (DE3) pLysS (Merck) were transformed with the pGEX-LC3 plasmid and grown in LB at 37 °C. Protein expression was induced at an optical density at 600 nm (OD600) of 0.6 by adding 0.25 mM IPTG, followed by incubation for 20 h at 18 °C. Cells were collected by centrifugation and resuspended in lysis/bind/wash buffer (10 mM Na2HPO4, 1.8 mM KH2PO4, 140 mM NaCl, 2.7 mM KCl, 0.05% Tween-20, pH 7.4). For HA–LB1 expression, bacterial cultures transformed with pDHFR-3HA-LB1(WT, Δ, 5A or F454A/L457A) were grown under the same conditions, with induction at OD600 = 0.3 using 0.25 mM IPTG, followed by 24 h of incubation at 18 °C. Cells were collected and resuspended in lysis/bind/wash buffer. The cell suspensions were then lysed by one freeze–thaw cycle followed by sonication. The lysates were clarified by centrifugation at 40,000 rpm for 30 min at 4 °C (SW-55, Beckman). For GST pull-down preparation, the cleared GST–LC3 lysates were incubated with glutathione Sepharose 4B resin (Cytiva), which was pre-washed with PBS and equilibrated with Lysis/bind/wash buffer for 1 h at 23 °C. The resin was then loaded into MicroSpin columns (Cytiva) and washed with lysis/bind/wash buffer to remove unbound proteins. GST-only control samples were prepared by treating GST–LC3 lysates with PreScission Protease (Cytiva) overnight at 4 °C to remove LC3. Cleared HA–LB1 lysates were loaded onto the columns containing either GST–LC3 or GST alone and incubated for 3 h at 4 °C. After washing with lysis/bind/wash buffer, bound proteins were eluted using elution buffer (50 mM Tris-HCl (pH 8.0) and 20 mM reduced glutathione). Throughout the procedure, 1 mM DTT and protease inhibitor cocktails (25955-24, Nacalai Tesque) were included in buffers. Eluted samples were analysed by SDS–PAGE (EHR-T1020L, ATTO) and transferred to PVDF membranes for western blotting. Membranes were pre-blocked with 1× TBS containing 1% casein blocker (Bio-Rad) before incubation with primary anti-HA antibody (1:3,000, 51064-2-AP, ProteinTech) and HRP-conjugated anti-rabbit IgG secondary antibody (1:1,000, 32460, Thermo Fisher Scientific) for 1 h each at room temperature. Blots were developed using chemiluminescent substrate (WestDura, Thermo Fisher Scientific) and imaged on the ChemiDoc MP (Bio-Rad) system. Post-developed membranes were washed and treated with Ponceau S for protein detection.Nuclear isolation assayEmbryos were first injected with mRNA (350 ng µl−1 of mCherry-flLB1(5A) or mCherry-flLB1(F454A/L457A)) at 12–14 h.p.i. and then collected at 24 h.p.i. Soon after the zona pellucida was removed by acidified Tyrode’s solution and washed three times in PBS containing 0.01% PVA, the embryos were mechanically crushed using glass capillaries (inner diameter, around 10 µm) and nuclei were isolated in M2 medium at 22 ± 1 °C. The capillary’s luminal surface was pre-coated with 10% polyvinylpyrrolidone solution (28315-72, Nacalai Tesque). Isolated nuclei were transferred to a high-salt buffer (200 mM NaCl in 1% Triton X-100/PBS) at 22 ± 1 °C and then timelapse imaging was immediately started (interval, 1 min) using the microscope setup described above (objective lens: 40× (Plan Apo, 0.95 NA; Nikon)).ExM analysisFertilized mouse embryos were fixed at 24 h.p.i. and permeabilized according to the above immunostaining protocol and then incubated with the primary antibody (anti-lamin B1 mouse IgG, 1:100, sc-374015, Santa Cruz) for nuclear envelope staining at 4 °C overnight. After three washes with 3% BSA/PBS, the embryos were incubated in the dark with goat anti-mouse IgG (H+L) cross-adsorbed secondary antibody and Alexa Fluor 568 (1:100, ab175473, Abcam) at 4 °C overnight. After washing with 0.01% PVA/PBS and equilibrating with 100 mM sodium carbonate (pH 8.5, 191-01305, Wako) for 15 min at room temperature, the samples were incubated with a cross-linking agent (0.1% glycidyl methacrylate)63 in 100 mM sodium carbonate at room temperature overnight, followed by five washes with PBS. The samples were then placed in a glass-bottom dish pre-coated with 50 ng µl−1 poly-l-lysine (P1399, Sigma-Aldrich). Gel polymerization was performed by soaking the samples in a monomer solution, which was prepared by mixing 1.388 ml of N,N-dimethylacrylamide (274135, Sigma-Aldrich), 0.32 g of sodium acrylate (QC-1489, Combi-Blocks) and 2.85 ml of double-distilled H2O after purging with nitrogen gas. The monomer solution was then replaced with the gelling solution, which was prepared by mixing 180 µl of monomer solution, 0.036 g ml−1 of potassium persulfate (379824, Sigma-Aldrich) and 0.8 µl of N,N,N′,N′-tetramethylethylenediamine (T7024, Sigma-Aldrich), and incubated for 2 h at room temperature in a humidified chamber. The gels were then treated with a digestion solution prepared by mixing 16 U ml−1 proteinase K (EO0491, Thermo Fisher Scientific) and 486.7 µl of TTSDS buffer (2% TAE buffer (1610743, Bio-Rad), 0.5% Triton X-100 (T8787, Sigma-Aldrich) and 1% SDS (313-90275, NIPPON GENE)) for 1 h at 37 °C in a humidified chamber64. Finally, the gel was expanded in double-distilled H2O while exchanging the buffer five times at every 1 h, followed by overnight incubation in double-distilled H2O. Finally, the samples were stained with 1 µM SYTOX Green (S7020, Thermo Fisher Scientific) for 1 h at room temperature. After washing with double-distilled H2O three times, the gel was placed in a glass-bottom dish (0030 740.009, Eppendorf) and imaged using the spinning-disk confocal microscope with the objective lens of ×60 (Plan Apo VC, 1.20 NA; Nikon).Image analysesMeasurement of nuclear shapeFor 3D nuclear imaging, nuclear shape was reconstructed from z-scanned 2D images using Imaris software (v.9.8.2, Oxford Instruments). Confocal slices acquired across nuclei at 1 µm intervals were used to reconstruct the images, and the parameter values (nuclear sphericity, distance of Pol II foci from the nuclear periphery) were calculated using the Imaris Surfaces function. For 2D nuclear imaging, the contour of each nucleus, visualized using either H2B–mCherry or emerin–eGFP, was detected at the equatorial plane by using Jfilament2D plug-in of Image J (v.1.48; throughout analyses) after processing the image with a median filter for noise reduction (2 × 2 pixel). The centroid position of the nucleus (x0, y0) was then determined based on the nuclear contour, and the average radius (R) of the nucleus was calculated according to the following equation:$$\langle R\rangle =\frac{1}{N}\mathop{\sum }\limits_{\theta =0}^{359^\circ }\sqrt{{({x}_{\theta }-{x}_{0})}^{2}\,+\,{({y}_{\theta }-{y}_{0})}^{2}}$$
(1)
Here, (xθ, yθ) are the positions of the nuclear contour at the angle θ (0° ≤ θ x0, y0). N is the number of datapoints set at 1° intervals (360). Subsequently, a perfect circle of the radius R was drawn from the nuclear centre and the deviation of the nuclear contour from the circle was calculated at each angle θ using LEAP in Image J. The extent of nuclear deformation (D) was determined as a mean deviation of the nuclear contour from the perfect circle according to the following equation:$$\langle D\rangle =\frac{1}{N}\mathop{\sum }\limits_{\theta =0}^{359^\circ }|(r(\theta )-R)|$$
(2)
Here, r(θ) is the distance of the nuclear contour from the nuclear centre at the angle θ. Other symbols are as defined above. For analyses of H2B–mCherry images, the nuclear contour was detected at their outer edges. For analyses of emerin–eGFP images, the nuclear contour was detected at their inner edges as their outer edges exhibited disorganized signals.Measurement of nuclear mechanical propertiesNuclear deformability (S) in the nanocapillary-based mechanical measurement was determined according to the following equation:$$S={S}_{\max }-{S}_{0}$$
(3)
Here, S0 is the initial resting length of the nucleus measured before stretch, and Smax is the maximal length that the nucleus reached before detachment from the nanocapillary. Each nuclear length was determined along the micromanipulation axis by measuring the distance between the nanocapillary’s contact point and its opposite point across the nucleus. The analysis was performed using either H2B–mCherry or emerin–eGFP with consistent results (Extended Data Fig. 2g). The pre-stretched nuclear size at the one-, two- and four-cell stages was 20.2 ± 2.7 µm (n = 18 embryos), 14.8 ± 1.8 µm (n = 12 embryos) and 15.5 ± 1.6 µm (n = 13 embryos), respectively.The effective nuclear stiffness (K) was estimated based on the maximal nuclear deformation (S) and the amount of the force (F) generated at the nanocapillary tip, according to K = F/S. The force F (17 nN) was determined as the product of the applied suction pressure and the area at which the pressure was applied (that is, the bore size of the nanocapillary). The bore size was measured for each nanocapillary by filling its interior with a dye solution. The speed of nuclear translocation associated with the nanocapillary movement was 0.26 ± 0.15 µm s−1 (n = 107 measurements). The viscous resistance associated with this movement was estimated according to the Stokes–Einstein equation, which was given by Fv = 6πηaV. Here, η is the cytoplasmic viscosity (1.2–3.6 Pa s)65,66, a is the average nuclear radius and V is the average speed of nuclear translocation. The estimated viscous resistance from the cytoplasm was over 100 times smaller than the force holding the nucleus by the nanocapillary (0.05–0.16 nN). The cytoplasm was assumed to be predominantly viscous and fluid-like as the nuclei did not return to the original position after detachment from the nanocapillary (Extended Data Fig. 2d–f).The nuclear elasticity (Fig. 1l) was determined based on the extent of nuclear shape recovery, by calculating the ratio of the nuclear length before stretch (S0) to the nuclear length after detaching from the nanocapillary and reaching a new steady-state (Sr), according to the following equation: \(R={S}_{0}/{S}_{r}\times 100\). The newly attained nuclear length Sr was determined by fitting the relaxation time course of the nuclear length to an exponential decay function.The mechanical resistance of nuclei in Extended Data Fig. 2l–n was examined using an increased suction pressure applied to the ~2 µm bore glass capillaries while simultaneously monitoring the nuclear shape and the pressure level at which the nuclear surface was aspirated inside the capillary (>1 µm from the capillary tip). Time-lapse images of nuclei visualized with H2B–mCherry or H2B–eGFP were used to monitor the nuclear shape.Quantification of lamin signals at the nuclear peripheryEquatorial planes selected from confocal slices of immunostaining or live-embryo images were used to quantify fluorescence intensities of lamins in Image J. For analysis of lamins in fixed embryos, the following procedure was followed: first, in each two-colour image composed of lamin IF and DAPI counterstain, the nuclear contour was detected by an automatic thresholding of the DAPI signal after median filtering (2 × 2 pixel). For analysis of lamins in live embryos, the nuclear contour was detected using lamin signal after median filtering (2 × 2 pixel). A band was then drawn with the line width of ±1 μm from the detected nuclear contour and transferred to the corresponding lamin image, with which the integrated fluorescence intensity within the band (Itotal) was measured. The total area of the band covering the nuclear contour (A) was also obtained. The background fluorescence (Ibg) was estimated based on intensities inside and outside the nuclear area adjacent to the band (ibg_in and ibg_out, respectively; ±2 μm area from the detected nuclear contour excluding the band) according to the following equation:$${I}_{\mathrm{bg}}=\{({i}_{\mathrm{bg\_in}}+{i}_{\mathrm{bg\_out}})/2\}\times A$$
(4)
Finally, the mean signal intensity of lamin at the nuclear contour (Ilamin) was determined according to the following equation, by subtracting the total background (Ibg) from the integrated signal intensity (Itotal) measured within the band.$${I}_{\mathrm{lamin}}=({I}_{\mathrm{total}}-{I}_{\mathrm{bg}})/A$$
(5)
To determine the half-time (t1/2) of lamin B1 clearance, the time-dependent changes of lamin B1 signal density measured at the nuclear periphery (IlaminB1) were subjected to a fitting with the following exponential decay function67. Datapoints associated with transient high-intensity noise at the nuclear periphery or its interior were excluded from the fitting:$${I}_{\mathrm{laminB}1}=a\times (1-\exp (-bt))+c$$
(6)
Here, a is the initial value of the signal density, b is the decay rate, t is the elapsed time (min) and c is a constant offset. Then, the decay time constant (t1/2) was determined according to the following equation:$${t}_{1/2}=-\mathrm{ln}(0.5)/b$$
(7)
With this procedure, the time constants estimated from the ensemble average and from individual sample fits agreed within 10%.Quantification of lysosomes and lamin B1 fociAfter median filtering of the images acquired (2 × 2 pixel), lysosomal and lamin B1 foci were detected by signal thresholding (focus size, >0.4 µm). Then, their numbers were counted using Objects Counter plug-in of ImageJ (3D; size filter Measurement of nuclear shape in ExMThe comparison of nuclear shape between non-expanded and expanded samples was made by analysing the contour of each nucleus, which was visualized using lamin B1 immunostaining. The images were median filtered (2 × 2 pixel) and then loaded in Jfilament2D. After the detection of the nuclear contour, the aspect ratio, roundness and solidity were calculated using the shape analysis tool in Image J. Nuclear deformation was calculated according to equation (2).Local nuclear deformation was analysed by measuring the deviation of the nuclear contour from the perfect circle (radius: R) at each angle θ according to the following equation:$${D}_{\mathrm{ExM}}=(r(\theta )-R)/R$$
(8)
Negative and positive values of local nuclear deformation (DExM) were assigned as concave and convex deformation, respectively. DNA and lamin B1 signals at the nuclear periphery (±1 µm from the nuclear contour) were measured at each angle θ using LEAP. The outliers of DNA and lamin B1 intensity, detected by the ROUT test (GraphPad Prism v.10.3.1), were excluded from the analysis. The correlation coefficient between nuclear deformation and either DNA signal or lamin B1 signal was calculated using Pearson’s correlation analysis (GraphPad Prism v.10.3.1). The occupancy of DNA signal in concave and convex regions was calculated by dividing the number of points at which DNA signal exceeded the mean signal at the nuclear periphery by the total number of points at each region.Variance analysis of lamin and DNA signals in ExMTo assess the coefficient of variation of lamin signals at the nuclear periphery, z-stack images of individual nuclei in the lamin channel were first processed with background subtraction using a rolling ball radius of 50 pixels in Image J. The Ridge Detection plugin was then applied to generate lines overlapping the nuclear envelope. Signal intensity along these lines was measured at regular intervals across all z-planes. All intensity datapoints from the same nucleus were compiled and used to calculate the coefficient of variation using GraphPad Prism (v.9.5.0). For the DNA signal analysis at the nuclear periphery adjacent to the lamin signal, background subtraction with a 50-pixel rolling ball radius was also applied to the DNA channel. An irregularly shaped line was manually drawn along the nuclear periphery at the central z plane (that is, the best-focus plane). The DNA signal intensity was measured along this line at uniform intervals. All datapoints from the same nucleus were then used to calculate the CV using GraphPad Prism.Measurement of RNA pol II localizationIn the 3D reconstructed immunostaining images, RNA Pol II Ser2P foci were detected and their coordinate positions were determined using the Surface function of Imaris. The images acquired using SYTOX were also used to visualize the nuclear periphery using the Surface. After collecting the top 10% of the detected Pol II foci on the basis of their total signal intensity, the distance of the foci from the nuclear periphery and foci size were automatically calculated. The local nuclear curvature nearest the individual Pol II foci was examined for those within 3 µm from the nuclear periphery, by visual inspection of the 3D nuclear image. After 3D images were reconstructed using SYTOX, the DNA mass volume was automatically calculated. The analyses were conducted using a blind test with two individuals and the obtained data were averaged.Measurement of γ H2A.X foci numberFor the detection of γH2A.X foci, the Surface function of Imaris was used. The images acquired using DAPI were also used to visualize the nuclear periphery using the Surface. After collecting the top 20% of the detected γH2A.X foci on the basis of their total signal intensity, the number of γH2A.X foci was automatically calculated.RT–qPCRTotal RNA was extracted from a pool five two-cell embryos at 28 h.p.i. using PicoPure RNA Isolation Kit (Life Technologies; KIT0204) according to the manufacturer’s protocol. cDNA was synthesized from the extracted RNA using Superscript III RT First-Strand Synthesis System (Life Technologies; 18080051). cDNA samples were analysed in 7300 Real Time PCR System (Applied Biosystems). Microsoft Excel was used to analyse the expression data. The primer sequences are as follows: Kdm5b_F (5′-CAAAAGGCAAACAAGGTATCGAT-3′); Kdm5b_R (5′-GCAGAGCATACAGCTGAGTCACA-3′); Obox3_F (5′-CCTGGTTCCATACCTGTTGTTGA-3′); Obox3_R (5′-TCACCAAATGTGCCTGAACAC-3′); Obox6_F (5′-TTCCATTCCCAACCTCAACTG-3′); Obox6_R (5′-TGGCACTATCACAGGCCTGAT-3′); Gapdh_F (5′-CATGGCCTTCCGTGTTCCT-3′); Gapdh_R (5′-GCGGCACGTCAGATCCA-3′).RNA-seqA pool of three to five IVF embryos at the two-cell stage (28 h.p.i.) per condition was treated with acid Tyrode, followed by three times washes with 0.1% BSA/PBS, and the samples were then transferred to a 0.2 ml tube containing 9.5 μl of reaction buffer (Z5013N, Takara) to make a final volume of 10.5 μl. After cell lysis in the buffer, 1 μl of the solution was removed and, instead, 1 μl of the appropriately diluted ERCC RNA Spike-In Mix was added (Thermo Fisher Scientific, 4456740). SMART-seq library preparation was performed using SMART-Seq HT Kit (Z4437N, Takara), SMART-Seq mRNA HT (634795, Takara) and Nextera XT DNA Library Preparation Kit (FC-131-1096, Illumina) according to the vendor’s instructions. We followed the previously published protocol for RNA-seq of mouse embryos68. The analysis was performed with three to four biological replicates. For overexpression of full-length lamin B1 constructs (flLB1(5A) and flLB1(F435A/L437A), embryos showing collapsed nuclear morphology were excluded from sampling by microscopy observation.The paired-end sequencing data (150 bp + 150 bp) were obtained on the Illumina NextSeq 2000 platform. Raw reads were first subjected to filtering to remove low-quality reads using Trimmomatic69. Reads of less than 20 bases and unpaired reads were also removed. Furthermore, adaptor, poly(A), poly(T) and poly(G) sequences were removed using Trim Galore! (https://www.bioinformatics.babraham.ac.uk/projects/trim_galore/). The sequencing reads were then mapped to the mouse genome (mm10) using STAR70. Reads on annotated genes were counted using featureCounts71 RNA-seq reads were visualized using Integrative Genome Viewer (IGV)72. The sequence data were screened by leveraging mutated sites of exogenously introduced mRNA to validate proper introduction into samples. FPKM values were calculated from mapped reads by normalizing to total counts and transcripts. DEGs (Padj 2) were then identified using DESeq273 by normalizing with ERCC RNA spike-in counts. A hierarchical clustering of the read count values was performed using hclust in TCC (unweighted pair group method with arithmetic mean: UPGMA). Principal component analysis (PCA) of the global gene expression profile was performed using scikit-learn and the plots were depicted using plotly. Expression levels were compared based on FPKM values using Heatmapper 1.0 (https://heatmapper.ca/). Using GREAT (http://great.stanford.edu/public/html/), functions of DEGs were predicted. To visualize normalized enrichment of ChIP–seq read counts (H3K4me3: GSE72784; and H3K9me3: GSE97778)30,74 at sfLB1-downregulated genes in mouse two-cell embryos, heat maps were depicted using computeMatrix and plotHeatmap in deepTools75.Cut&TagThe previously published Cut&Tag protocol76 was optimized for two-cell embryos. We especially searched for a condition in which the embryonic nuclear structure was maintained even after the initial permeabilization step in buffer containing Triton X-100 and found that the brief Triton X-100 treatment (30 s) enabled the retention of the two-cell nuclear structure as judged by DAPI staining while ensuring permeability for antibodies to gain access to nuclear antigens as summarized in Extended Data Fig. 8a. Fertilized embryos injected with or without sfLB1 + GFP mRNA (120–150 embryos) were micromanipulated during 24–28 h.p.i. to remove polar bodies, as signals from polar bodies were not negligible. Embryos free of polar bodies were transferred to an ice-cold extraction buffer (25 mM HEPES-NaOH (pH 7.5), 50 mM NaCl, 3 mM MgCl2, 300 mM sucrose and 0.5% Triton X-100) and incubated for 30 s. After three times washes in an extraction buffer without Triton X-100, the embryos were lightly fixed with 0.1% formaldehyde in PBS for 2 min. The fixation was then stopped by transferring the embryos to a Ca- and Mg-free M2 buffer containing FBS. The embryos were washed in an antibody buffer (20 mM HEPES-NaOH (pH 7.5), 150 mM NaCl, 0.5 mM spermidine, 0.1% BSA, 2 mM EDTA and 1× protease inhibitor cocktail) and incubated with the primary antibody (anti-H3K4me3 rabbit IgG in the antibody buffer (1:50); Active motif, 39159) overnight at 4 °C. After the primary antibody reaction and washing with antibody buffer (three times for 20 min each), the embryos were incubated with the secondary antibody (mouse anti-rabbit IgG-HRP antibody in the antibody buffer; 1:50, sc-2357, SantaCruz) for 1.5 h at room temperature. The embryos were incubated in a wash buffer (20 mM HEPES-NaOH (pH 7.5), 150 mM NaCl, 0.1% BSA, 0.5 mM spermidine and 1× protease inhibitor cocktail) (three times for 20 min each). The prepared embryos were treated with the pA-Tn5 adaptor complex (1:20 dilution in wash buffer without BSA) for 90 min at room temperature. After the treatment, embryos were further washed with wash buffer containing BSA (three times for 20 min each) and the washed embryos were transferred to a tube filled with Tagmentation buffer (10 mM MgCl2 in wash buffer without BSA), followed by incubation at 37 °C for 1 h in a water bath. The tagmentation reaction was stopped by adding EDTA, SDS and proteinase K and incubating at 50 °C for 2 h. Such samples were reverse-cross-linked by incubating at 65 °C for 16 h. DNA was collected by conventional phenol–chloroform extraction and ethanol precipitation. The collected DNA pellet was resuspended in 20 μl of 0.1× TE buffer and treated with RNase A. The DNA was PCR-amplified using Q5 High-Fidelity Master mix (NEB) and 0.25 μM barcoded primers with the following PCR program: 72 °C for 5 min; 98 °C for 30 s; 18 cycles of 98 °C for 10 s and 63 °C for 30 s; a final extension at 72 °C for 1 min; and hold at 4 °C. The produced DNA library was purified using the 1.1×AMPure XP magnetic beads (Beckman Coulter) method and finally eluted in 12 μl of RNase-free water. After the concentration check by BioAnalyzer (High sensitivity kit, Agilent Technologies), the library was subjected to sequencing on the DNBSEQ-G400 platform (paired end 150 bp, MGI).The sequenced reads were first trimmed using Trimmomatic69 and then aligned to the mouse genome (GRCm38/mm10) using bowtie2 software77 (v.2.4.4). All aligned reads were then sorted and indexed by SAMtools78 function, sort and index, respectively. The duplicated reads were removed using picard (https://broadinstitute.github.io/picard/): MarkDuplicates with the –REMOVE_DUPLICATES option. To increase the number of reads for accuracy, we performed sequencing twice. The resulting two FASTQ files were merged using the SAMtools function merge. Peak calling was performed using MACS279 Enrichment of Cut&Tag peaks and the previously published ChIP–seq peaks for H3K4me3 were compared over randomly shuffled peaks to examine the significant enrichment. The program deepTools75 (v.3.2.1) functions, computeMatrix and plotHeatmap, were used to draw tag density plots and heat maps for read enrichment. For the visualization of read enrichment over representative genomic loci, bigwig files were generated from sorted BAM files using deepTools function, bamCoverage and visualized by using IGV. To examine the reproducibility of the Cut&Tag experiments, the Pearson correlation was calculated by the deepTools function, multiBigwigSummary and plotCorrelation, using CPM-normalized bigwig files.DNA seqFISHPrimary probe preparation for seqFISHFor ZGA loci we selected Obox6 and Kdm5b; Gabarapl1 served as a negative-control region. Existing probe sets for these loci were retrieved from PaintSHOP80 (https://paintshop.io) or, for the controls, reused exactly as described in a previous report36. Each primary probe comprises a 30–37-nucleotide genomic targeting sequence, four identical 15-nucleotide secondary-probe docking sites and 20-nucleotide primer sites at both the 5′ and 3′ ends. Four distinct 15-nucleotide barcodes were designed—one for each round of our multiple cycle imaging scheme, which includes the above-mentioned genomic loci plus the DNA-tagged anti-RNA polymerase II phosphorylated at serine 2 (Pol II Ser2ph) antibody. Between 185 and 400 primary probes were designed per locus; a list of all of the sequences is provided in Supplementary Table 4.Oligonucleotide pools were obtained from Twist Bioscience as oligo arrays and amplified essentially as described previously36. In brief, the pool was first amplified with primers seqDNA1F (5′-ATGCGCTGCAACTGAGACCGA-3′) and seqDNA1R (5′-CTCGACCAAGGCTGGCACAA-3′) using KOD One PCR Master Mix (Toyobo). After purification (DNA Clean-and-Concentrator, Zymo Research), a second round of PCR was performed with seqDNA1F and seqDNA2R (5′-GAGCTAATACGACTCACTATAGCTCGACCAAGGCTGGCACAA-3′). The resulting template was transcribed in vitro with the MEGAshortscript kit (Thermo Fisher Scientific, AM1354). Single-stranded DNA was generated by reverse transcription with primer seqDNA_revT (5′phos-ATGCGCTGCAACTGAGACCGA-3′) and Maxima H Minus reverse transcriptase (Thermo Fisher Scientific, EP0751), followed by alkaline hydrolysis of RNA (1 M NaOH, 65 °C, 15 min), neutralization with 1 M acetic acid and ethanol precipitation. The purified ssDNA probes were resuspended in primary-hybridization buffer to around 1 nM per probe, consisting of 35% (v/v) formamide, 2× SSC and 10% (w/v) dextran sulphate. If precipitates were observed, the solution was heated to 65 °C for 15 min to dissolve them. Probes were stored at –20 °C until use.For intron RNA sequential FISH (seqFISH), we selected Kdm5b and Gabarapl1 as target genes. Obox6 was not included in the intron RNA seqFISH analysis because its intronic regions showed substantial repetitive content, precluding sufficiently specific probe design. Intronic target regions were defined by retrieving gene and exon annotations for each gene and computationally subtracting the merged exon intervals from the annotated gene body. Intronic segments shorter than 150 bp were excluded from further analysis. Candidate intronic probe sets were then designed using PaintSHOP. Each primary probe comprised a 30–37-nucleotide genomic targeting sequence and four identical 15-nucleotide secondary-probe docking sites. Two distinct 15-nucleotide barcodes were used, corresponding to the multi-cycle imaging scheme for Kdm5b and Gabarapl1. Twenty-four primary probes were designed per gene, and a list of all of the sequences is provided in Supplementary Table 5. Probe pools were synthesized as oPools by Integrated DNA Technologies (IDT), dissolved in RNase-free water and stored as concentrated stocks until use. Immediately before use, the probe pool was diluted to 1 nM per probe in hybridization solution containing 50% (v/v) formamide, 10% (w/v) dextran sulfate, 2× SSC and RNase-free water.Oligo-conjugated antibody preparationThe preparation of oligonucleotide DNA-conjugated primary antibodies was conducted as previously described36. In brief, a mouse monoclonal anti-Pol II Ser2ph antibody (Pc26; AB_2819246) (100 μg) underwent buffer exchange to PBS through 50-kDa Amicon Ultra Centrifugal Filters (Millipore, UFC505096) and was treated with 10 equivalents of PEGylated SMCC cross-linker [SM(PEG)2] (Thermo Fisher Scientific, 22102) diluted in anhydrous N,N-dimethylformamide (Fijifilm, 043-32361). After incubation at 4 °C for 2 h, the solution was purified using 7 kDa molecular weight cut-off Zeba Spin desalting columns. Concurrently, 300 μM 5′-thiol-modified 18-nucleotide DNA oligonucleotides—composed of an AAA base sequence and a 15-base secondary probe binding sequence (Eurofins) ([ThiolC6]AAACGCTCTACGTTAACA)—was reduced with 50 mM dithiothreitol in PBS at room temperature for 2 h and purified using NAP5 columns (GE Healthcare, 17-0853-01). Maleimide-activated antibodies were then combined with 11 equivalents of the reduced form of the thiol-modified DNA oligonucleotides in PBS and incubated at 4 °C overnight. The resulting DNA–primary antibody conjugates were washed four times with PBS and concentrated using 50 kDa Amicon Ultra Centrifugal Filters. The concentrations of the conjugated oligonucleotide DNA and antibodies were quantified using a BCA Protein Assay Kit (Thermo Fisher Scientific, 23225) and NanoDrop (Thermo Fisher Scientific).Functional validation of the conjugated antibodies was confirmed through SDS–PAGE and Coomassie Brilliant Blue staining, which demonstrated the expected reduction in electrophoretic mobility due to oligonucleotide conjugation. Additional verification was conducted through IF, using fluorophore-conjugated secondary antibodies that recognize the host species of each antibody; successful nuclear staining affirmed the functionality of the oligonucleotide-labelled antibodies.DNA/IF seqFISHFixed embryos were rinsed in PBS and stored in PBS containing 1% polyvinylpyrrolidone (PVP, Mr ≈ 360,000) until use. Embryos were subsequently immobilized for the forthcoming hybridization and wash cycles by embedding them in a thin polyacrylamide hydrogel. For covalent anchoring of the gel, 24 mm × 50 mm no. 1 S glass coverslips (thickness, 0.16–0.19 mm; Matsunami) were first silanized with methacrylate groups: the coverslips were immersed for 5 min in a freshly prepared solution containing 0.1% (v/v) 3-(trimethoxysilyl)propyl methacrylate in 80% ethanol and 2% acetic acid, rinsed three times with absolute ethanol and air-dried in a low-humidity, dark environment. A 4% polyacrylamide solution (19:1 acrylamide:bis-acrylamide) was prepared in 1× PBS with 0.1% Tween-20; polymerization was initiated by adding 0.1% ammonium persulfate (APS) and 0.1% N,N,N′,N′-tetramethylethylenediamine (TEMED). To embed the samples, individual fixed embryos were transferred to the methacrylate-coated slide in a small drop of PBS and allowed to settle onto the glass surface. Excess liquid was gently removed to avoid dilution of the monomer solution. Approximately 4 µl of the polyacrylamide solution was pipetted over the embryo, after which a non-stick Gel Slick-coated glass chip (5 mm × 7 mm, t = 1.0 mm; Matsunami Glass) was gently placed on top. Two stacks of Scotch Mending Tape (0.058 mm thick; 3 M) were affixed as spacers at opposite edges of the sample area, so that the chip rested on the tape risers and compressed the gel to a uniform thickness of around 100 µm across the embedded embryo. Gel polymerization was carried out in a humidified chamber at 37 °C for 2 h. To improve the polymerization efficiency, the chamber was purged with nitrogen gas for about 2 min to remove oxygen before sealing and incubation. After polymerization, the top coverslip was carefully removed, leaving the embryo embedded in a thin polyacrylamide pad affixed to the slide. A Fluorescent Friendly double-sided adhesive film (FL-S-2L; Grace Bio-Labs) was cut into a rectangular frame (24 mm × 50 mm) with a central elliptical aperture (major axis ≈ 22 mm, minor axis ≈ 19 mm; projected area ≈ 328 mm2; film thickness, 0.28 mm). One adhesive face was laminated onto the sample coverslip so that the hydrogel-embedded embryo lay precisely at the centre of the oval window. The opposite adhesive face was then sealed with a custom cover-glass (26 mm × 76 mm × 2 mm; Matsunami) bearing two circular access ports (diameter, 1.3 mm; centre-to-centre spacing, 18 mm; positioned at mid-height). This arrangement created a leak-tight chamber of around 0.28 mm internal height (approximately 92 µl volume), while the paired ports served as inlet and outlet for buffer exchange during sequential hybridization and imaging cycles.The gel-embedded embryos were permeabilized with 0.25% Triton X-100 in PBS for 1 h at room temperature. Blocking was performed by incubating the samples in PBS containing 10 mg ml−1 UltraPure BSA (Invitrogen, AM2616), 0.3% Triton X-100, 0.1% dextran sulfate and 0.5 mg ml−1 sheared salmon sperm DNA (Invitrogen, AM9680) for 15 min at room temperature. A DNA oligonucleotide–conjugated Pol II Ser2ph antibody (Pc26, AB_2819246) was diluted in blocking buffer supplemented with SUPERase·In RNase inhibitor (Invitrogen, AM2694; 1:100) and applied to the embryos at a final concentration of 0.2 µg per 100 µl. Embryos were incubated with the antibody at 4 °C for 48 h, washed three times with PBS and then post-fixed in freshly prepared 4% (w/v) formaldehyde in PBS for 5 min at room temperature to stabilize the antibody–antigen complexes. Cross-linking was further reinforced by treating the samples with 1.5 mM BS(PEG)5 in PBS for 20 min at room temperature. After cross-linking, any remaining reactive groups were quenched by incubating the samples in 100 mM Tris–HCl (pH 7.5) for 5 min. The embryos were then washed again in PBS.The embedded embryos were incubated in a mixture of RNase A and RNase T1 (Thermo Fisher Scientific, EN0551, 1:100 in PBS) at 37 °C for 1 h, then rinsed thoroughly in PBS. Genomic DNA was denatured in situ to allow probe binding: embryos were incubated in denaturation buffer (50% formamide and 2× SSC) at room temperature for 15 min. The chamber ports were sealed with Adhesive Seal Tabs (Grace Bio-Labs), after which the slide was rapidly heated on a 90 °C dry block for 4–5 min to denature the genomic DNA. Immediately after this heat-denaturation step, the samples were transferred into 4× SSC to avoid re-annealing of DNA and to wash away formamide. Primary probes were hybridized simultaneously to the denatured DNA. Hybridization was carried out in a humid chamber at 37 °C for 120 h. The hybridization buffer contained 35% formamide, 2× SSC and 10% dextran sulfate (w/v) to promote DNA annealing; probes were added at a final concentration of approximately 0.2 µM for each target. After the approximately 5 day incubation, the samples were washed to remove excess and non-specifically bound probes. After hybridization, the samples were rinsed for 15 min at room temperature in a 40% wash solution comprising 40% (v/v) formamide, 2× SSC and 0.1% Triton X-100, and then washed three additional times in 4× SSC. To lock the primary probes in place, a universal 31-nucleotide ligation bridge oligonucleotide (5′-TCAGTTGCAGCGCATGCTCGACCAAGGCTGG-3′; 100 nM final) was applied in 20% hybridization buffer (20% formamide, 10% dextran sulfate and 4× SSC) and incubated for 2 h at 37 °C. Excess bridge was removed with three 5 min washes in 10% wash buffer (10% formamide, 2× SSC, 0.1% Triton X-100), and then rinsed three times in 1× PBS. Ligation of the 5′ and 3′ termini of each primary probe was then carried out for 1 h at room temperature using Quick Ligase (New England Biolabs, M2200) diluted 1:20 in 1× Quick Ligase Reaction Buffer supplemented with 1 mM ATP (Takara Bio). Embryos were washed for 5 min at room temperature in 12.5% wash buffer (12.5% (v/v) formamide, 2× SSC, 0.1% (v/v) Triton X-100), followed by three rinses in 1× PBS. To covalently stabilize the bound probes, chemical amine-modification was performed. The samples were pre-equilibrated in 1× labelling buffer A (Mirus Bio) and then incubated for 45 min at room temperature in labelling buffer A containing a 1:10 dilution of Label IT amine modifying reagent (MIR 3900, Mirus Bio). Excess reagent was removed by three washes in 1× PBS. The embryos were post-fixed in 1.5 mM BS(PEG)5 and incubated for 30 min at room temperature, followed by quenching in 100 mM Tris-HCl (pH 7.5) for 5 min. The samples were then washed for 5 min in 55% wash buffer (55% (v/v) formamide, 2× SSC, 0.1% (v/v) Triton X-100) and rinsed three times in 4× SSC to remove residual formamide. The embryos were either imaged immediately for DNA/IF seqFISH, or stored in 4 °C 4× SSC until imaging.We performed sequential hybridization–imaging cycles, one for each target (the genomic loci plus the DNA-tagged anti-Pol II Ser2ph antibody). In every cycle, the sample was simultaneously incubated with a secondary probe and a single universal Alexa Fluor 647-labelled readout oligonucleotide (Supplementary Table 4). The secondary probe carries a sequence complementary to the four identical docking sites on the primary probe and, in turn, presents four tandem copies of the readout binding site; the fluorophore therefore binds indirectly through the secondary probe36. For the first round, the Obox6 secondary probe was used, followed by the Kdm5b secondary probe, Gabarapl1 and finally the Pol II Ser2ph secondary probes. Both probes were diluted together in EC buffer (10% ethylene carbonate, 2× SSC) to final concentrations of 0.1 µM (secondary) and 0.4 µM (readout) and hybridized for 1 h at room temperature before washing and imaging. After the 1 h hybridization, excess readout probe was removed by three rinses in 4× SSC, followed by a brief wash in 4× SSC containing 0.1% (v/v) Triton X-100. The samples were then stringently washed in 12.5% wash buffer (12.5% formamide, 2× SSC, 0.1% Triton X-100) and rinsed three additional times in 4× SSC. The buffer was replaced with a DAPI staining solution (4× SSC, 0.1% Triton X-100, 5 µg ml−1 DAPI) and incubated for 2 min at room temperature, after which the chamber was filled with anti-bleaching buffer (50 mM tris-HCl (pH 8.0), 300 mM NaCl, 2× SSC, 3 mM trolox (Sigma-Aldrich, 238813), 0.8% d-(+)-glucose (Nacalai Tesque, 16806-25), 1,000-fold diluted catalase (Sigma-Aldrich, C3155) and glucose oxidase (0.5 mg ml−1; Sigma-Aldrich, G2133)). After buffer exchange, the embryos were imaged sequentially in three channels: Alexa Fluor 647 for read-out probe signals, red fluorescent protein (RFP) to detect mCherry, and DAPI for nuclear counter-staining. Imaging was performed using the Nikon Ti-2 inverted microscope equipped with a Yokogawa CSU-W1 spinning-disk confocal scanner, a Plan Apo λ S 60× silicone-immersion objective (NA 1.30), and an ORCA-Fusion BT scientific-CMOS camera (Hamamatsu Photonics), driven by Nikon NIS-Elements software (v.5.42.06). Excitation was provided by 405 nm, 561 nm, and 637 nm laser lines (LightHUB ULTRA, Omicron). z-stacks spanning 45 µm were acquired with a 300 nm step size (151 optical sections), yielding a voxel size of 110 nm × 110 nm × 300 nm. After imaging each round, the fluorophore-labelled readout probe was removed (stripped) to prepare for the next target. Stripping was achieved by incubating the sample in a formamide-rich buffer (55% formamide, 2× SSC, 0.1% Triton X-100) for 15 min at room temperature. The sample was then rinsed again in 4× SSC to remove formamide, and the next Alexa 647–labelled readout oligo was introduced. This cycle of hybridization, washing, imaging and probe stripping was repeated to individually detect each of the genomic loci and Pol II Ser2ph.DNA/intron RNA seqFISHFor DNA/intron RNA seqFISH, fixed embryos were embedded in thin polyacrylamide hydrogels and permeabilized as described above. Thereafter, all of the procedures were carried out under RNase-free conditions using RNase-free water and RNase-free SSC solutions. The gel-embedded embryos were first incubated in blocking buffer containing 1× PBS, 10 mg ml−1 UltraPure BSA (Invitrogen, AM2616), 0.3% Triton X-100, 0.1% dextran sulfate, 0.5 mg ml−1 sheared salmon sperm DNA (Invitrogen, AM9680) and SUPERase In RNase Inhibitor (Invitrogen, AM2694; 1:100) for 15 min at room temperature. The samples were washed in PBS, post-fixed in freshly prepared 4% (w/v) formaldehyde in PBS for 5 min at room temperature, further cross-linked in 1.5 mM BS(PEG)5 in PBS for 20 min at room temperature and quenched in 100 mM Tris-HCl (pH 7.5) for 5 min. The embryos were then rinsed in 2× SSC and incubated with the intron probe hybridization solution in a humid chamber at 37 °C for 72 h. After the hybridization, excess RNA primary probes were removed by washing the samples in 55% wash buffer, comprising 55% (v/v) formamide, 2× SSC and 0.1% Triton X-100, for 30 min at room temperature, followed by three washes in 4× SSC.We next performed sequential RNA hybridization-imaging cycles before the DNA seqFISH rounds. We performed sequential hybridization–imaging cycles, one for each target (Kdm5b and Gabarapl1). In every cycle, the sample was simultaneously incubated with a secondary probe and a single universal Alexa Fluor 647-labelled readout oligonucleotide (Supplementary Table 5). The secondary probe carries a sequence complementary to the four identical docking sites on the primary probe and, in turn, presents four tandem copies of the readout binding site; the fluorophore therefore binds indirectly through the secondary probe36. For the initial round the Kdm5b secondary probe was used, followed by the Gabarapl1 secondary probe. Both probes were diluted together in EC buffer (10% ethylene carbonate, 2× SSC) to final concentrations of 0.1 µM (secondary) and 0.4 µM (readout) and hybridized for 1 h at room temperature before washing and imaging. After the 1 h hybridization, excess readout probe was removed by three rinses in 4× SSC, followed by a brief wash in 4× SSC containing 0.1% (v/v) Triton X-100. Samples were then stringently washed in 12.5% wash buffer (12.5% formamide, 2× SSC, 0.1% Triton X-100) and rinsed three additional times in 4× SSC. The buffer was replaced with a DAPI staining solution (4× SSC, 0.1% Triton X-100, 5 µg ml−1 DAPI) and incubated for 2 min at room temperature, after which the chamber was filled with anti-bleaching buffer (50 mM tris-HCl (pH 8.0), 300 mM NaCl, 2× SSC, 3 mM trolox (Sigma-Aldrich, 238813), 0.8% d-(+)-glucose (Nacalai Tesque, 16806-25), 1,000-fold diluted catalase (Sigma-Aldrich, C3155) and glucose oxidase (0.5 mg ml−1; Sigma-Aldrich, G2133)). After buffer exchange, the embryos were imaged sequentially in four channels: Alexa Fluor 647 for read-out probe signals, RFP to detect mCherry, green fluorescent protein (GFP) to detect eGFP, and DAPI for nuclear counterstaining. After imaging each round, the fluorophore-labelled readout probe was removed (stripped) to prepare for the next target. Stripping was achieved by incubating the sample in a formamide-rich buffer (55% formamide, 2× SSC, 0.1% Triton X-100) for 15 min at room temperature. The sample was then rinsed again in 4× SSC to remove formamide, and the next Alexa-647-labelled readout oligo was introduced. This cycle of hybridization, washing, imaging and probe stripping was repeated to detect each of the RNA signals individually.After completion of the RNA imaging rounds, the samples were rinsed in 1× D-PBS(−) and incubated with RNase A/T1 Mix (Thermo Fisher Scientific, EN0551), diluted 1:100 in 1× D-PBS(−), at 37 °C for 1 h to remove residual RNA before DNA seqFISH. The samples were then rinsed three times in 1× D-PBS(−), transferred into denaturation buffer containing 50% formamide and 2× SSC for 15 min at room temperature, sealed to prevent formamide evaporation, and heated on a 90 °C dry block for 4 min 30 s. Immediately thereafter, the samples were transferred into 4× SSC and processed as described above for DNA seqFISH.DNA/RNA/IF seqFISH image analysisFor image processing and quantitative analysis, raw Nikon ND2 files from each hybridization round were opened in Fiji with the Bio-Formats importer and automatically concatenated into a single five-dimensional (x, y, z, channel, time) hyper-stack. Each fluorescence channel was denoised with a three-dimensional median filter (1-pixel kernel). The DAPI channel was smoothed with a 3D mean filter (two-pixel kernel) and corrected for photobleaching using the bleach correction–simple ratio method. Sample drift within each stack was removed with the Correct 3D Drift plugin, using the DAPI signal as reference; the sequential imaging rounds were then co-registered by the Descriptor-based series registration plugin with an affine 3D +t model. Out-of-focus slices were discarded. Nuclear regions were identified in the corrected DAPI volume by Gaussian blurring (σ = 30 pixels), global thresholding, morphological closing and connected-component labelling with the 3D Objects Counter, generating bounding boxes for every nucleus. These bounding boxes were converted to regions of interest (ROIs); all voxels within each ROI were duplicated into individual multipage TIFF files, and integrated as well as mean fluorescence intensities were measured within a fixed 118 × 118 pixel window centred on the ROI. Finally, maximum-intensity projections, annotated overlays and the registered 3D image stacks were exported.seqFISH images of embryos were analysed using Imaris v.10.2 software (Oxford Instruments). For analysing distances from the nuclear periphery to gene loci, a nuclear surface was created based on the DAPI intensity of each nucleus. Spot objects were generated based on signal intensities of Obox6, Kdm5b and Gabarapl1 loci. Then, to measure the distance from each spot object to the surface, ‘Shortest Distance to Surfaces’ was selected as a parameter in the ‘Spot’ module. The mean intensity of DAPI and Pol II Ser2ph in each genomic locus was quantified using ‘Intensity mean’ in the ‘Spot’ module. The clustering analysis of distances from the nuclear periphery to gene loci was performed with a custom Python code (Python v.3.12.4) using the DBSCAN function (Minimum Points: 3, radius: 0.648). The radius was determined by the k-nearest neighbours algorithm using a custom Python code. To quantify RNA FISH signals, we first determined RNA FISH foci with intensities above the threshold (Min: 130, Max: 165) throughout all samples. The identified foci were automatically recognized as spots in Imaris, and the spot size was then adjusted to fit individual foci. RNA FISH foci were therefore labelled as individual spots, and the total signal intensities within each spot (Intensity sum) were measured.Microsoft Excel (v.2508) was used to organize numerical data.Statistics and reproducibilityAll the statistical analyses described in the main text and Extended Data figures were performed using GraphPad Prism (v.9 or 10). The statistical tests were selected based on whether the assumptions of normality and equal variance were considered reasonable. Multiple-comparison correction was applied for post hoc analysis. Sample sizes were determined based on our previous studies27,68 and preliminary experiments; no statistical method was used. For each experiment, oocytes obtained from three to 16 female mice were pooled, and the resulting embryos were randomly allocated to experimental groups. Control data pooled across independent experiments were used as a reference for analyses, as measurements were highly consistent between experiments. Data exclusions were made based on the following quality control criteria: embryos with abnormal appearance (for example, degeneration); embryos in which nuclei were not captured on contact with the nanocapillary (for mechanical analysis); microscopy images containing intensity spikes; and RNA-seq data to check proper introduction of exogenous mRNA by screening against mutagenized sequence information. These exclusions were made before downstream analyses were conducted. Investigators were not informed of the hypothesis or the phenotypic effect of the mutant proteins for Figs. 4f–k and 5d−f. Blinding was not applicable for other analyses when morphological differences were apparent or when analysis required specialized knowledge of the sample. Where feasible, automated analysis procedures were used, or experiments and data analysis were performed by different investigators.Ethics statementAll animal experiments were carried out in strict accordance with the guidelines of the Institutional Care and Use of Laboratory Animals. Experimental protocols were approved by the Committee on the Ethics of Animal Experiments of Kindai University (KABT-31-003), Kyushu University (A24-337-1) or National Institute of Genetics (R4-9 to R8-2).Reporting summaryFurther information on research design is available in the Nature Portfolio Reporting Summary linked to this article.