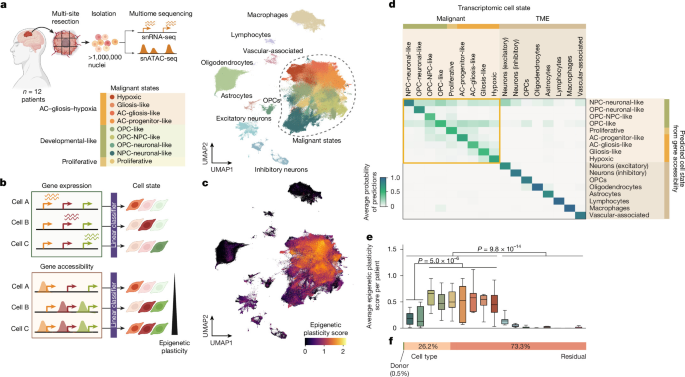
Human tissue collection and multiome profilingPatients with suspected GB gave pre-operative consent at Cambridge University Hospitals NHS Foundation Trust, with written informed consent obtained under the Declaration of Helsinki 2000 and ethical approval from the Cambridge Local Research Ethics Committee (REC 18/EE/0172). Tumours were resected under 5-aminolevulinic acid (5-ALA) guidance, sampled at multiple sites per tumour (targeting superior, anterior, posterior and middle regions where possible), embedded in OCT and flash-frozen. Cryosections from each block were assessed for RNA integrity after extraction, and only those with an RNA integrity number higher than 7 (Agilent Tapestation) were serially sectioned for parallel single-nucleus and spatial profiling. Nuclei were isolated from 50-µm cryosections by Dounce homogenization and Percoll gradient purification, and then processed with the 10x Genomics Chromium Next GEM Single Cell Multiome ATAC + Gene Expression assay at 5,000 to 10,000 nuclei per reaction, two to three reactions per site. A total of 57 sites were processed across 12 tumours. Libraries were paired-end sequenced on a NovaSeq 6000, targeting a minimum of 100,000 read pairs per nucleus per modality. Matched Visium libraries were prepared from adjacent sections, previously stained with haematoxylin and eosin (H&E) as reference, and sequenced on a NovaSeq 6000, targeting a minimum of 50,000 read pairs per spot. Full tissue processing and library preparation are described in our companion manuscript14.Multiome quality control, integration and cell-state annotationReads from snRNA-seq and snATAC-seq libraries were aligned with Cell Ranger ARC to a custom-built reference genome, combining the 10x Genomics GRCh38 pre-mRNA reference and the Cell Ranger ARC ATAC genome (v.1.0.1). Nuclei were filtered on gene and unique molecular identifier (UMI) counts and mitochondrial fraction, and doublets were removed with Scrublet69. ATAC data were processed with ArchR70 using thresholds on fragment counts and transcription start site (TSS) enrichment, then restricted to barcodes passing RNA quality control, yielding 1,025,329 nuclei. Transcriptome counts were integrated with scVI30, using patient, tumour site, reaction date and cell-cycle phase as batch covariates. Malignant populations were called from copy-number profiles inferred with inferCNV71, and clusters were annotated on the basis of marker expression. We assigned malignant subclusters to states by gene module scoring following Neftel et al.10, projection onto a first-trimester developmental brain atlas72 and gene set enrichment. A mapping between the Neftel states and ours is shown in Extended Data Fig. 1a. Atlas annotation was finalized in the companion manuscript14 after the analyses reported here were performed. Therefore, cell-state assignments used here correspond to an earlier version, but both annotations agree for 99.85% of malignant nuclei and for all neural and vascular microenvironment populations. Per-cell Topic activities together with both annotations are available via Zenodo at https://doi.org/10.5281/zenodo.21873381 (ref. 73).Epigenetic plasticity scoreAccessible chromatin at a gene locus that is not yet transcribed indicates a primed configuration poised for potential activation. We used the degree of decoupling between chromatin accessibility and transcription at marker gene level to quantify epigenetic plasticity—the capacity of a cell’s chromatin landscape to support transcriptional identities other than the one currently expressed. Following a previous study15, we trained a classifier to predict cell states from gene-expression profiles and applied it to gene accessibility profiles of the same cells. Cells whose accessibility is compatible with several transcriptional states are classified with low confidence and scored as more plastic.Epigenetic plasticity scores were computed on metacell groupings of the patient atlas, constructed by Leiden clustering (Scanpy74, tl.leiden(); resolution=1) of the scVI RNA embedding latent variable within each cell state, donor and batch stratum, resulting in a total of 16,423 metacells. Cell-state–donor–batch groups with fewer than 40 cells were directly considered a metacell. For each metacell, we computed mean RNA counts and mean ArchR gene scores, the latter of which aggregate ATAC signal over promoters, gene bodies and distance-weighted distal elements. We normalized both matrices to library size, and log-transformed the RNA count matrix. A multinomial logistic regression model was trained on the expression of 3,160 highly variable genes to predict the 17 cell states shown in Fig. 1a (80% of metacells as training fraction; 20% held-out fraction; Extended Data Fig. 1b). The model was then applied to scaled ATAC gene scores, and epigenetic plasticity scores were estimated as the Shannon entropy of the resulting class probabilities. Metacell scores were projected back to constituent single cells for visualization (Fig. 1c). Variance components (Fig. 1f) were estimated by ordinary least squares, with cell state and donor as fixed effects, followed by ANOVA. Supplementary Methods section 2 provides further information on factors contributing to epigenetic plasticity variance and on global RNA-to-ATAC coupling.scDORIscDORI infers eGRNs from paired single-cell or single-nuclei RNA-seq and ATAC-seq data. Dimensionality reduction and eGRN network inference are commonly considered as separate steps, and networks are inferred within discrete, predefined cell type annotations. scDORI unifies the two, so that latent factors themselves carry regulatory meaning. An encoder maps each cell to a low-dimensional representation, and mechanistically constrained decoders reconstruct the observed accessibility and expression from it. The constraints are what separate scDORI from conventional dimensionality reduction: a factor reconstructs the data well only if it corresponds to a coherent program in which TFs bind to accessible elements to control nearby genes. We call these factors Topics. Each Topic is a signed, enhancer-mediated network linking co-accessible peaks, co-expressed genes and their predicted activating and repressing regulators, so a factor’s targets and mode of action can differ between Topics depending on which peaks are accessible. Each cell is modelled as a mixture of Topics rather than assigned to a cluster, so networks vary continuously across cells and a single Topic can be active across several states. Training runs in mini-batches, enabling us to scale to millions of cells without aggregation. Detailed explanations of scDORI components and their motivations, as well as the training schedule and empirical null to filter eGRN links, are provided in Supplementary Methods 1.1 to 1.9, with the rationale relative to previous methods in Supplementary Methods 1.10 and 1.11. A schematic representation of scDORI architecture is shown in Extended Data Fig. 2a.Training scDORI on the atlas of patients with GBscDORI was trained on the single-nuclei ATAC-seq and RNA-seq profiles of 95% of the patient atlas cells and evaluated on the held-out 5%, using 182,677 highly variable peaks, 3,192 highly variable genes and 195 TFs to learn 50 latent factors (Topics). During phase 2 training for GRN inference (module 4), we froze the encoder and modules 1–3 to preserve the Topic representations learnt in phase 1 (see Extended Data Fig. 2a and Supplementary Methods 1.6). In addition, we used empirical Topic-level TF expression for GRN pruning, computed by averaging TF expression across cells in each Topic as input to module 4, rather than using the denoised TF estimates from module 3. Full hyperparameters are provided in Supplementary Methods Table 3 and guidance on their selection can be found in Supplementary Methods 1.8. We verified that scDORI-inferred Topic programs were consistent across model restarts (three distinct random seeds) by computing the Jaccard similarity between the top 500 genes of the most active Topic in each GB state and that of the reference run 0 (Extended Data Fig. 4d). Run 0 was used for all analyses hereafter. All Topics with a maximum activity greater than 0.1 across cells were considered for downstream analyses (31 out of 50). Topic activity across states and cell types, as well as TF activity across Topics, can be found in Supplementary Table 2. Dominant gene programs per Topic were identified by gene set enrichment analysis (GSEA, decoupler v1.6.0)75 comparing the top 250 genes of the Topic–gene matrix (Supplementary Methods 1.9.3) against all gene sets (15–500 genes in size) in MSigDB (v.2023.1.Hs) subcategories H, C2, C5 and C8. Enriched pathways across Topics are summarized in Supplementary Table 2 and Extended Data Fig. 3a.Benchmarking scDORIWe assessed the performance of scDORI across three complementary benchmarks: peak–gene link predictions, the learnt latent space and the ability of learnt eGRNs to explain differential gene expression. Peak–gene links were benchmarked against SCENIC+ on the ENCODE76,77 cell lines IMR90, K562 and GM12878, using simulated single-cell multi-omic profiles derived from bulk RNA-seq and ATAC-seq data for these lines, as described previously18. Predictions were evaluated against the benchmark of candidate enhancer–gene interactions (BENGI)33, a curated set of peak–gene interactions built from CRISPR perturbations, chromatin interaction assays and expression quantitative trait locus (eQTL) data for these lines, with performance quantified by the area under the precision-recall curve (AUPRC). The learned latent space was benchmarked against MOFA29 and SCENIC+18, the latter represented by AUCell78 scores over the same set of TFs as scDORI, both run on metacell profiles owing to memory demands. scDORI Topic activities were aggregated at the metacell level for fair comparison. The biological relevance of each latent space was scored by its ability to predict cell-state labels through logistic regression under fivefold cross-validation. Finally, inferred eGRNs were evaluated by how well they explain differential expression in an independent single-cell GB atlas10, following the GRaNPA framework21. For each pair of states or Leiden clusters, we formed a network from the union of TF–gene links in Topics with a mean activation higher than 0.2 in either population, then used logistic regression on signed TF–gene links to predict whether a gene was upregulated or downregulated. Model performance was scored by AUPRC and compared against SCENIC+ eGRNs and randomized eGRNs. Full details on the execution of each benchmark are provided in Supplementary Methods section 4.TRs and TSsTopic-level TF activity scores were defined as the aggregate regulatory strength of each TF across its target genes within a Topic, separately for activating and repressive links. Activity scores are normalized across both TFs and Topics so that they reflect the intensity of a TF’s activity in a Topic and its specificity to that Topic. TRs were defined as TFs with the highest downstream activation of genes within each Topic, ranked by activity score. We quantified repression toward alternative Topics as the number of binarized repressive links from each TF to the top 250 genes of every alternative Topic, z-scored across TFs. TFs with the strongest repression of genes from Topics of at least two alternative states were defined as TSs. Because a TF can be both a TR and a TS, we also defined a Topic regulation score as the sum of the activating and repressive scores, and a state regulation score as its activity-weighted aggregate across the Topics active in a state. Full details on the computation of each score are provided in Supplementary Methods 1.9.7.Epigenetic priming of TRsTo assess the epigenetic priming of TRs, we examined discrepancies between their expression and chromatin accessibility across the patient atlas. Given the high heterogeneity among GB cells, we used Topic activity patterns to define finer-grained cell subsets sharing similar regulatory dynamics: for each Topic, we selected the top 5,000 cells by Topic activity score and computed average TR expression and accessibility (ArchR gene score) within this subset. We min–max scaled expression and accessibility values across GB Topics to enable comparison. A TR was defined as epigenetically primed in a given Topic-defined substate if its scaled expression was lower than 0.3 and its scaled accessibility exceeded 0.5 (Extended Data Fig. 6a,e).TAP and TRSWe define the TAP as a measure of how readily cells in a source Topic A can activate the program of a target Topic B. It rests on the premise, supported by our gain-of-function screen and by classical reprogramming work79, that activating the TRs of B is sufficient to drive its program. The TAP between a given Topic pair is computed by analysing all activating links between TFs expressed in the source Topic A (min–max scaled average expression > 0.5; TFi) towards all TRs in the target Topic B (activity score > 0.05; TRj). Specifically, the product of three terms is computed for every TFi–TRj pair: (i) presence of an activating link from TFi to TRj (binary variable); (ii) scaled average accessibility of TRj in cells of Topic A; and (iii) total activation strength of TRj in Topic B (activity score). The sum of all TFi–TRj values reflects the potential of Topic A to activate Topic B. We use all regulatory links from ATAC-derived Topic eGRNs rather than the expression-pruned eGRNs, as they include all regulatory links towards regulators that are accessible but not necessarily expressed. See Supplementary Methods 1.4.6 for details on the ATAC-derived and expression-pruned eGRN versions. The TRS mirrors the TAP but focuses on repressive interactions between Topics. To that end, it considers repressive links between TFi–TRj pairs, in this case from expression-pruned eGRNs to corroborate repressive interactions, and the degree of chromatin closure of TRs (1 − accessibility) in Topic A for computation. Empirical significance levels for both were estimated by computing TAP and TRS values from randomized eGRNs (1,000 TF–gene permutations), and considering links above the 95th percentile of the null as significant. Both metrics are normalized by the number of TFs expressed in the source Topic and the self-activation of the target Topic to make scores comparable across sources. Total repression exerted by each Topic is computed as the aggregated TRS values from a source Topic towards all alternative Topics. Pan-state Topics 18, 31 and 39 were not included in TAP and TRS computations, because their non-specific activity across cells limits interpretation of the resulting links. Full details on TAP and TRS computation and implemented variations on the components of these metrics are described in Supplementary Methods sections 5 and 6. TAP and TRS scores across Topics, as well as individual contributions of each TF to the final scores are provided in Supplementary Table 4.Net transition potential between Topics and statesWe define the net transition potential between two Topics as the difference between respective TAP and TRS values. The total plasticity enabled by each Topic (Topic-driven plasticity) is directly derived from this value as the aggregated net transition potential from a source Topic towards all Topics active in alternative states. We assessed the concordance between Topic-driven plasticity and the average epigenetic plasticity scores of Topic-associated cells (top 5,000 cells) by computing the Pearson correlation between values across Topics. State-level regulatory interactions were derived by aggregating TAP and TRS values from all Topics active in state A towards all Topics specific to state B, weighted by the proportional activity of each Topic in its respective state. To filter out noise from Topics with low levels of activation, proportional activities are computed only across Topics whose average activity score exceeds two-thirds of the most active Topic in each state. The state transition potential is finally defined as the net effect between transition-promoting (aggregated TAP) and transition-restricting (aggregated TRS) interactions. State transition potentials reflect the permissiveness of the regulatory landscape in state A towards transitioning to state B; thus, positive or negative values should not be interpreted as fixed or impossible transitions. Further details on net transition potential and its comparison to related methods are provided in Supplementary Methods section 7.Spatial co-activity of TopicsWe used cell2location80 to map Topics onto spatial locations of 97 Visium spatial transcriptomics sections (338,481 spot transcriptomes) from the same 12 tumours that were profiled in our patient multiome atlas (see our companion manuscript for details on spatial section pre-processing14). The Topic–gene matrix (Supplementary Methods 1.9.3) was provided as the cell2location reference, thereby treating each scDORI Topic as a distinct transcriptional program for spatial deconvolution. For each Topic, spot assignment was determined by two criteria: (1) the inferred abundance of the Topic exceeded the median abundance for that Topic across all spots; and (2) the abundance exceeded a baseline threshold of 5, applied to filter low-signal assignments and retain only biologically meaningful spot–Topic associations. For each Topic pair in each tissue section, we computed the Euclidean distance between all spot pairs and identified the bottom 10th percentile of these distances, which represents the most proximal locations between these Topics in the section. We determined the degree of spatial co-activity between Topic pairs as the percentage of sections in which the mean pairwise Topic distance in this percentile is zero, corresponding to direct co-activity at the spot level. We only considered sections in which both Topics are active for this analysis. Each Topic pair was observed in at least 17 sections (60 on average) from at least 7 patients (10 on average) (Extended Data Fig. 8b). Pairwise Topic distances at the section level, number of sections and patients considered per Topic pair and Topic spatial co-activity across sections are provided in Supplementary Table 6.Temporal co-activity of TopicsWe determined temporal patterns of Topic activity along pseudotemporally ordered clonal populations in our patient atlas. Clonal populations were inferred jointly from snRNA-seq and snATAC-seq by detecting large-scale copy-number variations (CNVs) using inferCNV (RNA)71 and epiAneufinder (ATAC)81, matching modalities by shared cells and CNV profile similarity and assigning high-confidence clone identities through label spreading (full details in ref. 14). Pseudotemporal ordering with Cell2fate82 yielded 60 clonal trajectories with sufficient cell counts and pseudotime convergence. For each cell, scDORI Topic activity was smoothed using a 100-cell moving average over pseudotime-ordered cells, balancing resolution and noise reduction, and a net pseudotime score per Topic was defined as its activation-weighted average pseudotime within each clone. Directionally co-active Topic pairs were identified by first selecting clonal trajectories with significant activation of a reference Topic A (95th percentile activation > 0.3). Within these clones, a candidate target Topic B was considered if it met either of two criteria: (1) its 95th percentile activation was below 0.3 (no activity in the trajectory); or (2) its net pseudotime score exceeded that of Topic A (later activation in time). Co-activity between Topics A and B was computed for clonal trajectories in each directional set as the cosine similarity between their activation vectors across cells in the clone. A similarity of 0 was assigned when Topic B’s 95th percentile activation fell below 0.1 to minimize spurious associations. For each Topic pair, values were averaged across the top 10% of clones ranked by similarity to derive a temporal co-activity score, ensuring low scores genuinely reflect low transition likelihood rather than dilution from clones in which Topic B was simply inactive. A total of 57 out of 60 clones ranked among the top 10% for at least one Topic pair. Clones considered per Topic pair and temporal co-activity values are shown in Supplementary Table 7.Spatio-temporal concordance of predicted transitionsTo assess whether the regulatory logic captured by our net transition potential metric explains the spatio-temporal organization of tumours, we tested its consistency with spatial and temporal co-activity patterns, assuming that Topics connected by high transition potential should be spatially proximal and show coordinated activation over pseudotime. For each reference Topic A, we computed the Pearson correlation between (i) the vector of net transition potential values from Topic A to all other Topics and (ii) the corresponding vector of spatial or temporal co-activity scores. For spatial co-activity, we averaged net transition potential values from A→B and B→A to match the symmetrical nature of spatial distance. For temporal co-activity, we computed correlations separately for outgoing (A→B) and incoming (B→A) directions. Correlations with P 4i–j). We computed Pearson correlations between these values across n = 84 cross-state Topic pairs, considering P Calculating net transition potential with alternative eGRN inference methodsTo assess the importance of eGRN predictions in estimates of net transition potential, we inferred eGRNs with SCENIC+, trained on metacells from our patient atlas as described above, and scored TF activity with AUCell. To accommodate the Topic-based TAP framework, the mean AUCell activity across the top 5,000 cells with the highest activation of each Topic was used to determine TF regulators per Topic. Accordingly, TAP and TRS values were computed between scDORI Topic-defined cell populations, using (i) activating and repressive links from SCENIC+ GRNs and (ii) AUCell activity scores to rank the importance of each targeted TF in cells of the target Topic. We derived net transition potentials, Topic-driven plasticity and total repression per Topic, as described in the respective sections. Although the resulting SCENIC+-derived values still depend on scDORI Topic-derived populations, this approach isolates the contribution of eGRN inference to the final transition potential estimates. To further assess the benefit of Topic-specific eGRNs, we computed net transition potential values using a union scDORI GRN, comprising all TF–gene links captured across GB Topics. Method performance was determined by comparing Pearson correlations between (1) Topic-driven plasticity or total repression per Topic and average epigenetic plasticity of Topic-associated cells; (2) net transition potential and spatial co-activity; and (3) net transition potential and temporal co-activity. For the latter, correlations from outgoing and incoming links were averaged to yield a single value per Topic. Correlations with P t-tests were also performed for (2) and (3) to determine significant differences between methods (P 8g,h.Temporal TF dynamics along neuronal-like exit trajectoriesFor two pseudotime-ordered clonal trajectories starting from neuronal-like cells, we reconstructed the regulatory interactions between TFs over time to explain exit from the neuronal-like state. We split each trajectory into four stages reflecting distinct states or transitional periods, as determined by the temporal activity of Topics, and defined a set of active TFs for each stage on the basis of temporal expression patterns. The stage 1 set was restricted to safeguard repressors so that their regulation on state exit could be followed. Mean accessibility and expression of each stage TF group were computed across cells of each trajectory and plotted over pseudotime, with single-cell values binned in groups of 200 adjacent cells to denoise (moving average window, centred on each cell). Regulatory interactions at each stage were read from the merged eGRNs of all Topics co-active in that stage (Extended Data Fig. 11d,e).Analysis of the developmental brain atlasTo contextualize patterns of plasticity regulation inferred from our patient atlas, we performed analogous analyses on a published multiome atlas of the human cortex48. This atlas comprises 45,549 nuclei from 12 donor samples, collected across six time points spanning mid-gestation to adulthood. Analysis of this dataset served two purposes. First, as a reference for the epigenetic plasticity score, it contextualized the chromatin permissiveness of GB cells against the normal developing brain. Second, as a ground-truth benchmark for scDORI and the net transition potential framework, its well-characterized lineage hierarchy allowed evaluation of both the recovery of canonical regulators by scDORI module 4 and the inferred transition relationships. To score epigenetic plasticity, cells were grouped into six types of neuroectodermal cell (radial glia cells, NPCs, neurons, ACs, OPCs and oligodendrocytes), with microglia retained as a negative control. We trained a linear regression model to predict cell types on the basis of the gene expression of metacells (80/20% train/test split of 2,559 metacells), built as for the patient atlas but using cell type × sample stratum, and computed epigenetic plasticity scores on the basis of predictions using gene accessibility (see ‘Epigenetic plasticity score’ above and Extended Data Fig. 1d,e). scDORI was trained at the single-cell level using 30 instead of 50 Topics to reflect the smaller cohort and more compact lineage hierarchy. Modified hyperparameters for model training are shown in Supplementary Methods Table 4, and inferred Topic activity and TF regulation across cell types (author-defined label groupings) are in Extended Data Fig. 7b,c. Net transition potentials were computed for all Topics active in cells of dorsal telencephalic origin (13 of 30), defining TF expression and accessibility per Topic as the average across the top 500 cells of each Topic and considering TFs with an activity score greater than 0.05 as TRs. The resulting TAP, TRS and net transition potential values are shown in Extended Data Fig. 7d. Computed epigenetic plasticity and transition potential patterns between neurodevelopmental cell types were compared against lineage relationships previously confirmed by lineage-tracing experiments49,50,51,52. Values for all neurodevelopmental analyses are provided in Supplementary Table 5.Cell cultureS24 PDGCs were derived from freshly dissected tissue from adult patients after informed consent83. P3XX and BG5 PDGCs were provided by H. Miletic (University of Bergen)84. PDGCs were maintained under stem-like neurospheroid conditions and cultured in GB medium consisting of Dulbecco’s modified Eagle’s medium with F12 (DMEM/F12; Gibco), 1× B27 supplement without vitamin A (Life Technologies), insulin (5 µg ml−1, Gibco), heparin (5 µg ml−1, Sigma-Aldrich), basic fibroblast growth factor (bFGF; 20 ng ml−1, Thermo Fisher Scientific), and recombinant human epidermal growth factor (rhEGF; 20 ng ml−1, R&D Systems). All PDGC lines were authenticated with Illumina Infinium Methylation Analysis, which detects more than 850,000 CpG sites. HEK293T cells (CRL-3216, ATCC) were used to produce lentiviral particles and maintained in DMEM (Gibco) supplemented with GlutaMAX (1×, Gibco), penicillin–streptomycin (1×, Gibco), MEM non-essential amino acids (1×, Gibco), sodium pyruvate (1 mM, Gibco), β-mercaptoethanol (0.1 mM, Life Technologies) and cosmic calf serum (10% v/v, Thermo Fisher Scientific). All cell lines used were tested regularly for mycoplasma infections.Lentiviral production and transductionLentivirus was produced in HEK293T cells with third-generation packaging plasmids according to the Trono laboratory protocol85 (full plasmid list in Supplementary Table 12). Lentiviral particles were concentrated through supernatant ultracentrifugation (69,000g for 2 h at 4 °C) and stored at −80 °C. For transduction, single-cell suspensions of 1 × 10⁶ PDGCs were incubated with 10 µg ml−1 polybrene (Sigma-Aldrich) for 15 min at 37 °C and subsequently incubated with lentiviral particles for 24 h. After 48 h, cells were subjected to puromycin selection (2 µg ml−1), with medium changes every 2–3 days. TF manipulation was confirmed by qPCR, western blot or normalized read counts from RNA-seq.PDGC co-culture with primary cortical cellsPrimary cortical cultures were isolated from wild-type B6N mice at P0, as described previously86. In brief, the cortex from each mouse was carefully dissected in ice-cold Hanks’ balanced salt solution (HBSS; Gibco) and digested with papain (1.6% v/v in HBSS with 0.5 mM EDTA pH 8.0 (Invitrogen)) for 25 min at 37 °C. After washing twice, the tissue was resuspended in neuron plating medium (MEM, 5% fetal bovine serum (Sigma), 1× B27 Plus Supplement (Life Technologies), 0.4% d-glucose (Sigma) and 1% GlutaMAX) by gentle pipetting, filtered through a 70-μm cell strainer and seeded at a density of 180,000 cells per cm2 in wells previously coated with Matrigel (1:100 in DMEM, Corning) for at least 1 h at 37 °C. After 24 h, the medium was replaced with neuron growth medium (Neurobasal-A (Gibco), 1× B27 Plus Supplement, 5% fetal bovine serum and 1% GlutaMAX) with 25 μM 5-fluoro-2′-deoxyuridine (FUDR; Sigma). Primary cultures were allowed to mature for 7 days by replacing half of the medium every second day with neuron growth medium, with an additional 8 µM FUDR only on day 3. We confirmed the formation of electrical networks by day 7 through electrical field potential recording on parallel-seeded multi-electrode array (MEA) plates with the Maestro Pro multiwell device (Axion Biosystems) using the Axis Navigator software, as described61. PDGCs with respective perturbations were dissociated with Accutase (Life Technologies) and seeded onto primary cultures at a density of 14,000 cells per cm2 on day 7, unless otherwise stated. We replaced half of the medium every second day with fresh neuron growth medium until cell collection.Pooled gain-of-function screen of 55 candidate GB regulatorsTo systematically identify GB regulators driving state transitions, we performed a pooled overexpression screen of 55 candidate TFs in three PDGC lines (S24, P3XX and BG5) co-cultured with primary cortical cells. The TF panel comprised scDORI-predicted TRs (activity score > 0.5 in GB-associated Topics), together with TSs, TFs repressing Topics of at least two alternative states. Each TF was PCR-amplified from respective multiplexed overexpression of regulatory factors (MORF)87 TF vectors, each containing a unique transcriptional barcode, and cloned into a doxycycline (Dox)-inducible pLIX_puro backbone by HiFi assembly. TF sequence and correct insertion were verified by Sanger sequencing and restriction enzyme digestions. The TF library was assembled by pooling all TF vectors at equimolar ratios, with barcode-only controls at a 2:1 ratio to each TF. Fluorescently labelled PDGCs were transduced at a multiplicity of infection of 0.1 to favour single vector integration, selected with puromycin for at least 7 days and seeded onto day-7 primary cortical cultures at 9,000 or 14,000 cells per cm2. TF expression was induced with 2 µg ml−1 Dox 24 h later and maintained for 4 days until collection. Cells from four to six co-culture wells were scraped and pooled in phosphate-buffered saline (PBS) with 1% bovine serum albumin, and PDGCs were isolated by fluorescence-activated cell sorting (FACS) (BD FACSAria III or BD FACSAria Fusion; FACS gates are reported in Supplementary Fig. 1). Sorted PDGCs were fixed using the ScaleBio Sample Fixation Kit (PN2020001, Scale Biosciences) and stored at −80 °C for later processing. Three independent replicates were collected per line and seeding density, except for BG5 (9,000 cells per cm2 only). Libraries were prepared with the ScaleBio Single Cell RNA Sequencing Kit v1.1 (PN2020001) using custom-designed RT primers to improve barcode capture, sequenced on a NovaSeq X Plus and processed with the ScaleBio RNA pipeline v.2.1.0 using GRCh38 as the reference genome. We assigned barcodes with the ScaleBio CRISPR pipeline, adapted to the overexpression design. We retained cells with at least three barcode UMIs, with the dominant TF accounting for at least 70%, for a total of 261,566 barcode-assigned cells. For full details on library preparation, sequencing, and data preprocessing, see Supplementary Methods 9.1–9.2.TF-induced state and Topic shifts after overexpressionCells from the TF gain-of-function screen that passed all quality-control filters were projected onto the patient atlas by pooling them with 96,295 atlas cells (union of the top 5,000 cells per GB Topic), computing 200 principal components on 4,315 features and batch-correcting with Harmony88 using sample as a covariate. Logistic regression classifiers were trained on the atlas portion of the embedding to assign either the four core GB states (multinomial) or the 17 GB Topic classes (one-versus-rest). TME states (OPCs) and Topics (3: ACs and 40: OPCs) were also included during training as negative controls, and proliferative cells were excluded from the core-state classifier owing to their unstable state identity. The balanced accuracy of state and Topic assignment on held-out cells was 0.89 and 0.87, respectively. Full details on regression classifier training are provided in Supplementary Methods 9.3. We quantified overexpression efficiency per line as the log2-transformed fold change relative to control cells. Because both perturbed and control populations showed bimodal TF expression (Extended Data Fig. 5c; bimodality coefficient (BC) > 0.555, n = 55/55 TF OE, n = 54/55 control), analyses were restricted to perturbed cells with TF expression at least 1.5-fold above the control mean, and for every TF OE versus control comparison, control cells with endogenous TF expression (>10th percentile) were also excluded. Control state heterogeneity was changed minimally after such exclusions (Extended Data Fig. 5d,e). Effects were reported as the mean difference in state or Topic probability scores alongside Cohen’s d. Significance was tested by label permutation with matched subsampling over 1,000 permutations, Benjamini–Hochberg (BH)89 corrected across all TF-by-line-by-state comparisons, and called significant at P d > 0.2. We obtained similar results by assigning each cell to its most probable state and testing state shifts with Fisher’s exact odds ratios (BH-corrected FDR 9.4–9.7. All TF-induced effects at state and Topic level are reported in Supplementary Table 3.Comparison of TF-induced effects with scDORI predictionsWe assessed concordance between observed TF-induced identity shifts and scDORI predictions by testing whether overexpression of predicted regulators induced a significant increase in the linear regression probability score of (1) their predicted Topic of regulation and/or (2) the corresponding state of such Topic (Fig. 3b,c and Extended Data Fig. 5g,h). For TFs that were predicted to regulate multiple Topics or states, a prediction was scored correct if consistent with at least one. At the Topic level, we report the fraction of TF regulators (Topic regulation score > 0.25; Supplementary Methods 1.9.7) that significantly induce their Topic, and compare the intensity of the probability score shift with the predicted Topic regulation strength (Extended Data Fig. 5g and Supplementary Table 3). At the state level, we ranked TFs by state regulation score (Supplementary Methods 1.9.7) and compared the mean state shift of the top N regulators, mean(∆StateScoreTF_1,…, ∆StateScoreTF_n), with that of the remaining TFs, mean(∆StateScoreTF_n+1,…, ∆StateScoreTF_54) (Extended Data Fig. 5f). If regulation scores predict reprogramming strength, higher-ranked TFs should show stronger shifts. We repeated this analysis using SCENIC+-ranked regulators, training SCENIC+ on metacells of the patient atlas to infer eGRNs and ranking TFs by state-specific AUCell scores derived from these eGRNs. The concordance of observed effects with scDORI prediction is summarized in Supplementary Table 3.Reversible perturbation of state regulatorsThe effects of inducing and removing TF regulators of high-plasticity and low-plasticity states (MEOX2 and MYT1L, respectively) were assessed using a Tet-ON overexpression system in S24 PDGCs co-cultured with primary cortical cells. TdTomato-expressing PDGCs were transduced with Dox-inducible TF OE or empty control vectors, selected with puromycin for at least 7 days and seeded onto day-7 primary cortical cultures at a density of 14,000 cells per cm2. To assess the effects of TF induction, 2 µg ml−1 Dox was added to the growth medium on the day of seeding and replenished every second day with a half-medium change. To assess the effects of TF removal, 2 µg ml−1 Dox was added to PDGC growth medium 3 days before co-seeding to induce TF expression and removed 24 h after co-seeding. In both conditions, cells from three to six co-culture wells were pooled 6 days after, and PDGCs were isolated by FACS (BD FACSAria III, BD FACSymphony S6 or BD FACSDiscover S8) for ATAC and/or RNA sequencing. FACS gating is reported in Supplementary Fig. 1.Chemotherapy and radiotherapy of PDGCsTo assess the effects of MYT1L OE under therapeutic pressure, tdTomato-expressing S24 PDGCs transduced with Dox-inducible MYT1L or empty control vectors were exposed to standard-of-care chemotherapy or radiotherapy before Dox-mediated induction. For chemotherapy, PDGCs were treated with 300 µM temozolomide (TMZ; Sigma-Aldrich) for 4 days, with TMZ replenished on day 2. For radiotherapy, PDGCs were treated with 2 Gy ionizing radiation (MultiRad Faxitron 225) on two consecutive days. Both treatment regimens were confirmed to be effective against PDGCs, consistent with clinical response90. Surviving PDGCs from each treatment condition, or untreated controls, were cultured for 48 h in normal growth medium and subsequently seeded onto day-7 primary cortical cultures. MYT1L OE was induced after seeding by adding Dox to the medium (2 µg ml) and replenishing every second day with half-medium changes. Cells from three to six co-culture wells were collected after 6 days. PDGCs were isolated by FACS (BD FACSAria III, BD FACSymphony S6 or BD FACSDiscover S8) and processed for ATAC-seq.Bulk ATAC-seqATAC libraries were prepared as described24 from TF-perturbed or control PDGCs after neurospheroid culture or co-culture with primary cortical cells (vectors in Supplementary Table 12). In brief, 50,000 nuclei were isolated from single-cell PDGC suspensions, previously isolated by FACS if co-cultured. DNA was tagmented with in-house-assembled Tn5 (oligos in Supplementary Table 12) and extracted with the MinElute Purification Kit (QIAGEN). After the addition of P5 and P7 indexes to DNA fragments using PCR, amplified libraries were size-selected with AMPure XP beads (100−500 bp, Beckman Coulter), quality-checked on a D1000 High-Sensitivity Tape (Agilent TapeStation) and sequenced paired-end on the NextSeq 2000 platform (Illumina).Sequenced reads were processed with the nf-core ATAC-seq pipeline (Nextflow v.23.04.3)91. After quality control with FastQC (v.0.11.9)92, reads were trimmed with Trim Galore (v.0.6.7)93 and aligned to hg38 with BWA (v.0.7.17)94. Aligned reads were cleaned and filtered with SAMTools (v.1.17)95, BEDTools (v.2.30.0)96 and Picard (v.3.0.0)97. Peaks were called using MACS2 (v.2.2.7.1)98. Final quality checks were performed with MultiQC (v.1.13)99. Differential peak analysis was performed with DiffBind (v.3.16.0)100, adjusting the summits parameter to 500 bp and treating all differentially accessible (DA) peaks with FDR 101 and can be found in Supplementary Table 8. Differential accessibility of Topics was assessed by testing whether DA peaks in each comparison were significantly enriched for peaks associated with a given Topic (Topic-association score ≥ 0.95 in scDORI Topic–peak matrix; Supplementary Methods 1.9.2). We computed the percentage of Topic-associated peaks represented in opened or closed DA peak sets and tested significance with a one-sided hypergeometric test, using the full scDORI consensus peak set as background. P values were BH-adjusted across Topics, and FDR 9. We assessed enrichment of Topic signatures by GSEA, ranking DAGs by the maximum fold change of linked DA peaks and comparing them against Topic signatures, defined as the top 250 genes per Topic in the scDORI Topic–gene matrix (Supplementary Methods 1.9.3). We considered comparisons with 50 or more overlapping genes and P z-scored across states.Bulk RNA-seqBulk RNA-seq was performed from PDGCs (S24, P3XX or BG5) neurospheroid-monocultured or co-cultured with primary cortical cells, previously transduced with TF OE or knockout (KO) constructs, along with their respective controls (Supplementary Table 12). For each experiment, we took three biological replicates per condition, derived from independent transduction batches, and isolated total RNA using the Direct-zol RNA Miniprep kit (Zymo Research). We prepared RNA libraries for samples with Dox-inducible vectors with the SMART-Seq v4 Ultra Low Input RNA Kit (Takara Bio) and subsequently processed them with the NEBNext ChIP-Seq Library Prep Master Mix Kit. Libraries from all other samples were prepared following the Illumina TruSeq Stranded Total RNA protocol. Final libraries were sequenced on NovaSeq 6000 or NovaSeq X Plus sequencers (Illumina). Sequenced reads were trimmed for adaptor sequences and masked for low-complexity or low-quality sequences. Reads were mapped to the hg38 reference genome using STAR102 and tested for differential expression with DESeq2 (ref. 103), with BH-corrected P 1.5). For PBX1 OE, SOX4 OE and MYT1L KO DEGs, a less stringent threshold of 0.5 was used given the lower number of total DEGs. For MYT1L-perturbed datasets, we assessed the enrichment of state signatures analogously, using all DEGs per condition and comparing them against state marker gene sets defined as the top 250 genes ranked by Scanpy’s rank_genes_groups() function applied to cells of each state in our patient atlas. We considered comparisons with P 10.CUT&RUN sequencingCUT&RUN was performed in S24 PDGCs 8 days after transduction with MYT1L OE or control vectors. Single-cell suspensions from three independent transduction batches were strained through a 70-µm filter, 100,000 cells were collected per sample and MYT1L-bound DNA regions were isolated following previously published protocols104. In brief, cells were bound to Concanavalin-A beads (Polysciences), permeabilized and incubated with 1 µg of MYT1L antibody (Millipore, ABE2915) at 4 °C for 1 h. Non-specific binding control experiments were performed for each sample with an IgG antibody (Sigma 12-370; 1:100 dilution). Unbound chromatin was digested with protein A-MNase + CaCl2 treatment, and undigested DNA was isolated by phenol–chloroform extraction. Libraries were prepared with the NEBNext DNA Library Prep Kit for Illumina (NEB, E7645) and sequenced paired-end on the NextSeq 2000 platform (Illumina). CUT&RUN data were analysed using the nf-core/cutandrun pipeline v.1.0.0 with Nextflow (v.23.04.3)91. Reads were aligned to hg38. Software versions: BEDTools (v.2.30.0)96, Bowtie 2 (v.2.4.4)105, deepTools (v.3.5.1)106, FastQC (v.0.11.9)92, MultiQC (v.1.14)99, Picard (v.2.27.4)97, SAMTools (v.1.16.1)95 and Trim Galore (v.0.6.6)93. Consensus peaks were defined with Genrich (https://github.com/jsh58/Genrich, v.0.6.6) using BH-adjusted FDR 101. Directly bound DA regions (DARs) and DAGs were identified as those in which the corresponding DA peak region directly overlapped with that of a MYT1L-bound peak. MYT1L-bound regions are listed in Supplementary Table 11.Construction and validation of neuronal-like TF regulonsWe define target genes for neuronal-like regulator TFs as those that are differentially regulated at both ATAC and RNA levels after TF overexpression in PDGCs. We exclude genes that change in opposite directions across modalities. For MYT1L, we used CUT&RUN-derived binding data to determine target genes, and defined their direction of regulation on the basis of significant changes in at least one modality. To assess the accuracy of scDORI predictions, we used the union of neuronal-like Topic eGRNs (24, 36, 37, 41 and 49) as the predicted regulon and quantified the overlap between predicted target genes and the experimentally determined target gene set. Prediction accuracy was defined as the percentage of overlapping genes changing in concordant directions. We performed the same analysis using TF eGRNs inferred by SCENIC+ exclusively in neuronal-like cells for comparison.PDGC proliferation assayProliferation of MYT1L-perturbed PDGCs (S24 and BG5) was determined with the AlamarBlue assay (Invitrogen). Neurospheroids were dissociated with Accutase at day 7 after transduction with MYT1L OE (S24; pLVX-puro_MYT1L), MYT1L KO (BG5; lentiCRISPRv2_gMYT1L) or the respective control constructs. Cells were seeded at 2,000 cells per well in 96-well plates (Corning), pre-coated with Geltrex (1:200 in DMEM/F12, 30 min, 37 °C, Life Technologies) and allowed to attach for 4 h. AlamarBlue reagent was added (10% v/v final) and incubated for 2.5 h at 37 °C and 5% CO2. After incubation, the metabolized medium was collected into a separate 96-well black microplate with clear flat bottom (Corning), and fresh growth medium was added back to the PDGCs. Fluorescence of the collected medium was measured on a Tecan Infinite M1000Pro microplate reader (excitation 535 nm, emission 590 nm). This measurement cycle (AlamarBlue exposure, medium collection, fluorescence reading) was repeated on days 3, 5 and 7, with cells maintained in culture for the full 7-day period. We calculated proliferation at each time point by normalizing fluorescence to the day-0 measurement.PDGC connectivity assayTo investigate the tumour microtube (TM)-forming capabilities of control and MYT1L-perturbed PDGCs, we used an established two-dimensional model57,107 in which Matrigel-coated vessels and glucose-supplemented, growth-factor-devoid GB medium (high-glucose medium; HGM) preserve both the transcriptional profile and the characteristic phenotypic features of human primary PDGCs, including infiltrative morphology and TM-network formation108. Imaging plates (96 wells; Greiner Bio-One) were freshly coated with growth-factor-reduced, phenol-red-free Matrigel (Corning) diluted 1:50 in growth-factor-free GB medium. TdTomato-labelled S24 and BG5 PDGC neurospheroids were dissociated with Accutase and resuspended in HGM. S24 PDGCs with or without MYT1L OE were seeded at 5,000 cells per well, and BG5 PDGCs with or without MYT1L knockdown at 7,500 cells per well, then incubated for 3 days to allow TM formation. TMs were visualized by incubating PDGCs with MemGlow560 (4 nM; Cytoskeleton) for 30 min before imaging, followed by three rinses with PBS. Images were acquired on a ZEISS LSM 710 ConfoCor 3 confocal microscope with a 20× (NA 0.8) dry objective using Zen Black v.8.1.0.484 (ZEISS). Nuclei and TM connectivity were quantified using a previously established pipeline57,109. Stained nuclei and cell bodies were segmented with Ilastik v.1.3.2 following extensive training, and the total TM length per region of interest (ROI) was estimated as the summed Euclidean distance divided by the nuclei count, reflecting the mean TM length per viable PDGC. To control for differences in nuclei density across ROIs, only ROIs within ±1 s.d. of the mean nuclei density were retained. Hoechst 33342 and tdTomato signals were oversaturated in displayed maximum intensity projections to improve the visibility of nuclei and TMs. OE, knockdown and respective control vectors can be found in Supplementary Table 12.Neuron–PDGC co-culture and morphology analysisPrimary hippocampal cultures were prepared as described above, dissecting hippocampi instead of cortical regions. TdTomato-expressing S24 PDGCs were transduced with MYT1L OE or control vectors on the day of hippocampal isolation, then dissociated with Accutase on day 7 and seeded onto the primary hippocampal cultures at a low density (4,500 cells per cm2) to favour PDGC–neuron over PDGC–PDGC interactions. Cultures were fixed 7 days later with 4% paraformaldehyde (15 min, room temperature), washed three times with PBS and imaged at 10× on a Nikon Ti-HCS inverted microscope (NIS-Elements software), capturing five or six images per independent experiment. Experiments were repeated three times, deriving cultures from three mice per experiment. Primary branches per cell were manually quantified by counting projections emerging directly from the cell body across ten cells (or all cells if fewer than ten) per field of view. Total branches per cell were quantified by counting all terminal branches per cell.Spheroid growth assaySingle neurospheroids of tdTomato-expressing S24 PDGCs, previously transduced with Dox-inducible MYT1L vector (pLIX-MYT1L; Supplementary Table 12), were transferred to the centre of a Geltrex-containing well (300 μl, 48-well plate, Corning) on ice and subsequently incubated at 37 °C for 1 h. Fresh PDGC growth medium with or without Dox (2 µg ml−1) was added to the embedded neurospheroids, which were maintained for 7 days with medium changes every 2–3 days. All neurospheroids were imaged at day 0 and day 7 on a DM IL LED fluorescence microscope (Leica) using the LAX software (4× magnification). Day-7 fluorescent images were binarized to create a spheroid mask, and raw integrated density was quantified within this area. Spheroid growth was determined by normalizing raw integrated density to day-0 spheroid area. Fold change in growth induced by MYT1L was computed by further normalizing to the average values in uninduced spheroids.Activator–repressor fusion assayTo determine whether MYT1L regulates proliferation and neurospheroid growth mainly through activation or repression, S24 PDGCs were transduced with Dox-inducible constructs encoding the minimal MYT1L DBD (410–623) (ref. 60) fused to either (i) the VP64 activator domain110 (four tandem repeats of the herpes simplex virus VP16 minimal activation domain; amino acids (aa) 437-447) or (ii) the Drosophila melanogaster engrailed (EnR) repressor domain111 (aa 1–298). AlamarBlue proliferation and spheroid growth assays were performed after adding 2 µg ml−1 Dox to PDGC growth medium, as described above. For proliferation assays, eight wells were seeded per condition per batch across three independent transduction batches. For spheroid growth assays, indicated spheroid numbers from three independent transduction batches were analysed, respectively. Proliferation and spheroid growth were determined by normalizing day-7 to day-0 values, as described in the respective assay sections. Values were further normalized to those of the respective non-induced controls to determine OE effects, and were compared with results obtained with full-length MYT1L OE.Patient-derived xenograft modelsPatient-derived xenografts were performed in male NMRI nude mice (8–10 weeks old, Charles River) to monitor tumour growth after MYT1L manipulation. For survival studies, S24 PDGCs, previously transduced with MYT1L OE or control vectors, were stereotactically injected into the cortex of mice (100,000 cells in PBS). For in vivo two-photon imaging, a chronic cranial window and titanium ring were implanted for pain-free head fixation during imaging, as described previously112. Two weeks later, tdTomato-labelled S24 PDGCs transduced with MYT1L OE or control vectors were injected into the cortex at a depth of 500 µm (300,000 cells in PBS). Intravital two-photon microscopy was performed 21 days after injection on anaesthetized mice (4% isoflurane induction, 0.5–2% maintenance) using a ZEISS 7MP microscope with a Coherent Chameleon Ultra II laser and a custom aperture for painless head fixation. Angiograms were obtained by tail-vein injection of FITC–dextran (2,000 kDa, FD2000S, Sigma-Aldrich). Fluorophores were excited at 750 nm (FITC–dextran) and 950 nm (tdTomato), using 500–550 nm and 575–610 nm bandpass filters. Tile scans (around 5,000 × 5,000 µm2) covering the injection site and both hemispheres were acquired at depths of 200 µm and 300 µm. Acquisition was unblinded to avoid mixing treatment groups. Images were analysed in Fiji, and PDGCs were counted manually after segmentation and summed across both depths. All mouse experiments were approved by the local authorities of Regierungspräsidium Karlsruhe. Tumour growth was monitored regularly, and mice were euthanized when tumours reached the maximum permitted tumour size or when humane end-point criteria were met. These limits were defined in accordance with the approved animal protocols and were not exceeded in any experiment. The mice were housed at the DKFZ animal facilities in accordance with the local and latest standards with a 12-h dark and light cycle and a constant temperature (20–24 °C) and humidity (45–65%). They were provided with a rodent-specific diet and water ad libitum.Statistics and reproducibilityNo statistical methods were used to predetermine sample size. Statistical testing was performed in Python or GraphPad Prism v.9.0, and details are provided in the corresponding figure legends and Methods sections. Mice for primary cultures and in vivo experiments were selected randomly before the indicated treatments. The investigators were blinded to the microscopy analysis and quantification. Otherwise, no blinding or randomization was performed. All figures were assembled in Affinity Designer, and Figs. 1a,b, 2a,d, 3a, 4a–e,g–j and 5a,d,f–i and Extended Data Figs. 1f, 2a, 6a, 7a, 8a,d, 9b, 10b,e,i,j and 11a were created in BioRender; Mall, M. https://biorender.com/51tfsoq (2026). Microsoft Excel v.16.0 was used to create and organize Supplementary Tables and Source Data.Reporting summaryFurther information on research design is available in the Nature Portfolio Reporting Summary linked to this article.