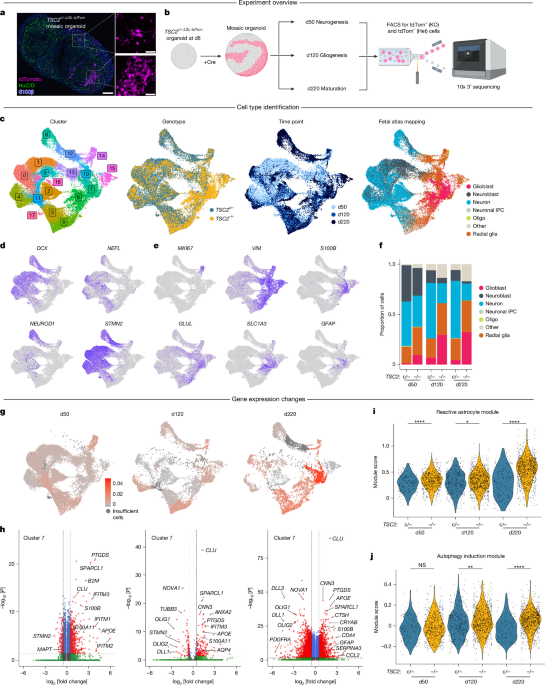
hPS cell cultureDerivation, maintenance and differentiation of human pluripotent stem cell lines was approved by the University of California, Berkeley Stem Cell Research Oversight Committee (protocol no. 2014-10-029). WIBR3 hES cells (National Institutes of Health (NIH) stem cell registry 0079) were initially obtained from R. Jaenisch’s laboratory62. WIBR3 hES cell lines were cultured according to published protocols63,64. hES cells were maintained on a layer of inactivated mouse embryonic fibroblasts (CD-1 strain, Charles River) in hPS cell medium, consisting of DMEM/F12 supplemented with 20% KnockOut Serum Replacement (Thermo Fisher, 10828010), 2 mM l-glutamine (Thermo Fisher, A2916801), 1% non-essential amino acids (Thermo Fisher 11140050), 0.1 mM 2-mercaptoethanol (Sigma, M6250) and 4 ng ml−1 fibroblast growth factor (FGF)-Basic (AA 1-155) recombinant human protein (Thermo Fisher, PHG0261). Cultures were passaged every 7 days with collagenase type IV (1.5 mg ml−1; Thermo Fisher, 17104019) and gravitational sedimentation by washing 3 times in wash media composed of DMEM/F12 supplemented with 5% fetal bovine serum (Thermo Fisher, A5670801) and 1,000 U ml−1 penicillin–streptomycin (Thermo Fisher 15070063).The BJ65, 8858 and 8119 hiPS cell lines were maintained in feeder-free conditions. BJ hiPS cells were generated by D. Hockemeyer and the 8858 and 8119 hiPS cells were obtained from S. Pasca at Stanford University. iPS cells were cultured on tissue-culture-treated six-well plates (Corning, 3516) coated with vitronectin (Gibco, A14700) and maintained in E8 media (Gibco, A1517001). Cultures were passaged using 7-min of room temperature incubation with EDTA (Thermo Fisher, 15575020).All cell lines were tested regularly for Mycoplasma contamination. On-target gene editing was confirmed by PCR (Extended Data Fig. 1b). Pluripotency status was confirmed by immunostaining with OCT4 and NANOG (Extended Data Fig. 1d). Genomic integrity of the stem cell lines was verified after gene editing using array comparative genomic hybridization (Cell Line Genetics) (Supplementary Table 11).Gene editing of hPS cells to generate TSC2 loss of-function was performed using CRISPR–Cas9 editing and validated in our laboratory as previously reported in ref. 27. In brief, constitutive TSC2 exon 5 deletion mutants were generated by electroporating cells with two px330 plasmids66 containing single-guide RNAs targeting the genomic regions of interest, as well as a GFP-encoding plasmid. After recovery, GFP-positive cells were selected using FACS, and single-cell-derived hPS cell colonies were manually picked, replated and expanded.WIBR3 TSC2c/−;LSL-TdTom hES cells, TSC2c/+;LSL-TdTom hES cells and BJ TSC2c/−;LSL-TdTom hiPS cells were generated using CRISPR–Cas9 gene editing as previously described in ref. 27. A single-guide RNA containing a TSC2 exon 5 cassette flanked by loxP sites was cloned into px330, electroporated into TSC2+/− or TSC2+/+ hES cells, and colonies underwent puromycin selection. The puromycin resistance cassette was removed, and the Ai9 tdTomato Cre reporter cassette was added to the AAVS1 safe harbour locus67 using the same genome editing methods described above.All unique biological materials in this paper (for example, gene-edited human stem cell lines) will be provided to qualified users on request and on completion of the relevant material transfer agreements.Organoid differentiationCortical organoid generation was performed as described previously in ref. 68. For feeder-based cultures, hES cells were isolated and removed from mouse embryonic fibroblasts using accutase (Stemcell Technologies, 07920) for 20 min. The cell suspension was collected and strained through a 40-μm strainer in hES cell media. This cell suspension was spun down for 5 min at 1,000 rpm. The supernatant was removed and resuspended in 5 ml of hES cell media without FGF2, supplemented with 10 μM Y-27632 dihydrochloride (Selleckchem, S1049). Cells were counted and resuspended to a concentration of 2.7 × 10⁶ cells per ml and 6 ml of this suspension was deposited into 1 well of a 6-well Aggrewell 800 plate (Stemcell Technologies, 34825). After the aggregation of single cells into embryoid bodies overnight, the embryoid bodies were removed and put into 10-cm ultra-low attachment dishes (Corning, 4615). On days 1–5, embryoid bodies were cultured in DMEM/F12 supplemented with 20% KnockOut Serum Replacement, 2 mM l-glutamine, 1% non-essential amino acids, 0.1 mM 2-mercaptoethanol, 1,000 U ml−1 penicillin–streptomycin, supplemented with 10 μM dorsomorphin (Abcam, ab146597) and 10 μM SB-431542 (R&D Systems, 1614/10).For feeder-free cultures, hiPS cells were cultured to high density (80–90% confluency). Then 24 h before aggregation, hiPS cells were pretreated with 1% dimethylsulfoxide (DMSO) (Sigma, D2438) in E8 media. For aggregation, hiPS cells were isolated using 7 min of incubation with accutase and 3 million cells in 2 ml of E8 were transferred into 1 well of a 24-well Aggrewell 800 plate (Stemcell Technologies, 34815). The following day, aggregates were dislodged and transferred into 10-cm ultra-low attachment dishes, with aggregates from 1 well being transferred into 2 10-cm dishes. From days 1 to 5, organoids were cultured in E6 media (Thermo Fisher, A1516401), supplemented with 2.5 μM dorsomorphin and 10 μM SB-431542.After day 5, feeder-based and feeder-free cultures followed the same protocol. On day 6, organoids were cultured in neural induction media, consisting of Neurobasal-A (Thermo Fisher, 10888022), B-27 Supplement minus vitamin A (Thermo Fisher, 12587010), 50 U ml−1 penicillin–streptomycin and 1× GlutaMAX (Thermo Fisher, 35050-061). During this time, neural induction media was supplemented with 20 ng ml−1 FGF2 (R&D, 233-FB) and 20 ng ml−1 epidermal growth factor (R&D, 236-EG). A full media change was performed every day from days 6 to 15 and then every other day until day 25. From days 25 to 43, the organoids were grown in neural induction media supplemented with 20 ng ml−1 brain-derived neurotrophic factor (BDNF) (Peprotech, 450-02) and 20 ng ml−1 NT-3 (Peprotech 450-03), with media changes every 4 days. From day 43 onward, organoids were maintained in neural induction media without BDNF or NT-3, with media changes every 4 days until collection.To generate mosaic organoids (TSC2c/−;LSL-TdTom and TSC2c/+;LSL-TdTom), organoids were transduced on day 8 postdifferentiation from hPS cells with UBC-Cre-RFP lentivirus (Kerafast, FCT224) by adding 5 μl of 1.0 × 10⁸ virus to each 10-cm dish containing roughly 20 organoids, with a media change after 24 h.Organoid dissociation for FACSDissociation of organoids for FACS followed a protocol for dissociation of mouse cortex for primary neuronal culture69. First, dissociation media was made consisting of calcium and magnesium free Hanks buffered saline solution (Invitrogen, 14185-052), 1 mM sodium pyruvate (Life Technologies, 11360070), 0.1% d-glucose (Sigma, G8769) and 10 mM pH 7.3 HEPES (Invitrogen, 15630-080). Next, the dissociation solution was made consisting of 5-ml dissociation media, 256 μl of Papain Solution (Worthington, LS003126), 0.067 mM 2-mercaptoethanol (Gibco, 21985-023), 1.1 mM EDTA (Thermo Fisher, 15575020) and 5.5 mM l-cysteine (Sigma, 168149). This solution was warmed at 37 °C for 15 min and then filter sterilized through a 0.22-μm filter. Organoids were transferred into dissociation media and incubated at 37 °C for 40 min. During this time, trypsin inhibitor solution was made, consisting of 10 mg of Trypsin Inhibitor (Sigma) in 10 ml dissociation media, prewarmed at 37 °C for more than 15 min and then filter sterilized. After incubation, the intact organoid was washed twice with trypsin inhibitor, then incubated in trypsin inhibitor for 4 min at 37 °C. During this time, the sorting buffer of 1× Dulbecco’s PBS with calcium and magnesium (Thermo Fisher, 14040117) with 10 μM Y-27632 was made and placed on ice. After 4 min at 37 °C, the trypsin inhibitor was removed from the tube with the organoid and 2 ml of sorting buffer was added. The organoid was then mechanically dissociated by triturating 5–10 times through a 5-ml serological pipette within this solution. The dissociated cell solution was then taken up into the serological pipette and passed through a 70-μm cell strainer into a 50-ml conical tube. This passed-through solution was then placed into a polypropylene FACS tube on ice.FACS and scRNA-seqDissociated cells were sorted on a BD Aria Fusion cell sorter with a 70-μm nozzle. When sorting for fluorophores, a negative control of a dissociated non-fluorophore labelled organoid was sorted first to ensure proper gating. After sorting, the cells were centrifuged at 300g for 5 min at 4 °C and then counted on a haemocytometer. Cells were then processed through the 10x Genomics 3′ single-cell sequencing pipeline for v2, v3 or v3.1 according to the manufacturer’s protocol. Complementary DNA from the 10x protocol was assessed for quality at the UC Berkeley Functional Genomics Laboratory using an Agilent 2100 Bioanalyzer, and libraries were prepared using the 10x Genomics protocol. Sequencing was performed at the UC Berkeley Genomics Sequencing Laboratory (QB3 Genomics, UC Berkeley, RRID SCR_022170) or at the Chan Zuckerberg Biohub San Francisco Genomics Platform (Supplementary Table 12).Processing and analysis of single-cell sequencing dataFASTQ files were aligned to a modified version of the human genome (GRCh38) using Cell Ranger v.6.1.2 (10x Genomics). Cell Ranger gene-expression matrix outputs were then loaded into Seurat v.5.1 (ref. 70). Data from each individual sample was turned into a Seurat object and metadata regarding time point, genotype and batch was added to each object. Each object was subset, extracting cells in which more than 500 RNA features were expressed and less than 20% of the genes expressed were mitochondrial. To integrate datasets within stem cell lines, each Seurat object was normalized using the SCTransform pipeline71. Seurat objects were then integrated by first finding the integration anchors using the oldest control samples as the reference. For WIBR3 TSC2c/−;LSL-TdTom hES cells, the day 220 TSC2c/− cells were used as a reference. For WIBR3 TSC2c/+;LSL-TdTom hES cells, the day 120 TSC2c/+ cells were used as a reference and for BJ TSC2c/−;LSL-TdTom hiPS cells, the day 140 TSC2c/− cells were used as a reference. Other parameters were left at their defaults and then the anchor set was integrated. Principal component analysis was then run on the postintegration cells, followed by UMAP dimensionality reduction using the first 20 principal components. Shared nearest neighbours for each cell and cluster were identified.The organoid datasets generated in this paper were projected onto a primary fetal tissue dataset29 by creating Seurat objects from the publicly available gene-expression matrices, finding the integration anchors between the organoids and the primary tissue data, and then integrating the two datasets into a single Seurat object. Downstream analysis of the integrated dataset was then performed as above.Differential expression was performed using MAST through Seurat’s FindMarkers function, with batch included as a latent variable72. Clusters with fewer than 3 cells in either condition were excluded from analysis. Cell type proportions were plotted using the DittoSeq v.1.18.0R package73, and volcano plots were plotted using the EnhancedVolcano v.1.20.0R package74. The genes used to calculate module scores are listed in Supplementary Table 2. Expression distance analysis was performed using the Cacoa v.0.4.0R package75. Pathway changes were analysed using the Single Cell Pathway Analysis v.1.6.1R package76. Spatial similarity maps were generated using the VoxHunt v.1.0.1R package77.Immunostaining of organoid sectionsOrganoids were fixed with 4% paraformaldehyde (PFA) (Electron Microscopy Sciences, 15710) for 2 h at 4 °C. After fixation, organoids were transferred to a 30% sucrose solution and allowed to settle at 4 °C overnight or at room temperature for 1 h. For cryosectioning, organoids were embedded in Tissue-Tek optimal cutting temperature (OCT) compound (Fisher Healthcare, 4585), frozen in an ethanol and dry ice bath, and sectioned on a cryostat (Leica, CM3050S) into 18-μm sections. Sections were washed once with 1× PBS and blocked in Block-Aid (Thermo Fisher, B10710) with 0.3% Triton X-100 (Sigma, X100) for 1 h at room temperature. Sections were incubated overnight at 4 °C in primary antibodies in Block-Aid. The following day, sections were washed three times with PBS, incubated in secondary antibody (1:500 in Block-Aid) and Hoechst stain (1:1,000, Thermo Fisher, H1399) for 1 h at room temperature and washed again 3 times with 1× PBS. Slides were coverslipped with ProLong Glass Antifade Mountant (Thermo Fisher, P36980) and allowed to cure before imaging. Antibody vendors, catalogue numbers and dilutions are listed in Supplementary Table 13.Confocal imaging and image analysisImages for all experiments, with the exception of the rapamycin and Torin experiments in Extended Data Fig. 9, were acquired using an Olympus Fluoview FV3000 confocal microscope, using Olympus FV31S 2.3.2.169. For organoid sections and 2D cultures, tile scans were collected using a ×10 or ×20 objective and stitched using ImageJ’s ‘Grid/Collection Stitching’ plugin using a PyImageJ v.1.8.0 wrapper. Individual cells were segmented using Stardist v.0.9.1 (ref. 78) on the nuclei channel, and debris was excluded using an area filter. For statistical comparisons, sample sizes were determined based on pilot experiments and prior publications in the field. Experimenters were not blind to genotype during experiments, however analysis pipelines were automated and the same settings were applied to all conditions. Randomization is not relevant to this study. For in vitro cultures, all comparisons were made within isogenic controls, so group membership was determined by genotype, rather than allocation. For human tuber data, comparisons were made between cell populations in the tuber.For intensity-based measurements, the regionprops_table() function from scikit-image v.0.25.2 was used with the Stardist labels and the corresponding intensity image. For certain protein targets that were expressed in the cell body but did not include the nucleus, the labels were expanded by 5 pixels to include the soma.To determine whether a cell was positive or negative for a particular marker, a binarization approach was used. The intensity image was postprocessed to remove noise or excessive background, and thresholded according to a mean filter. Stardist labels were then overlaid on the resulting binary image, and labels that contained more than 95% positive pixels were considered positive. Each analysis was validated by visualizing positive and negative cells using Napari v.0.6.6 (ref. 79) to confirm that cells were correctly classified.In the whole-organoid p-S6 analysis (Fig. 3c), a hybrid approach was used in which intensities from expanded labels were extracted only from cells that contained more than 50% positive pixels in the binarization approach. This approach restricted the analysis only to cells above a minimum detectable level of p-S6, as labelled nuclei with no detectable p-S6 were probably unviable.In the analysis of standard immunostaining in human tuber samples, only selected regions of tubers were imaged. Cells with fluorescence intensities greater than one standard deviation above the mean in a given image were considered to be high p-S6 cells, with all other cells considered to be low p-S6 cells. In the quantification of cyclic immunofluorescence, the full tuber section was imaged, and the high and low p-S6 thresholds were chosen manually for each tuber due to the variability across samples.Imaging astrocyte morphology in whole organoidsTo visualize astrocyte morphology in whole organoids, organoids were exposed to pAAV.GfaABC1D.PI.Lck-GFP.SV40 virus (Addgene, 105598)80 at low dilutions (TSC2−/−: 1:100,000; TSC2+/+: 1:10,000) at day 220 or 224. After 14 days, intact organoids were fixed with 4% PFA for 2 h at 4 °C and immunostained as described above (section ‘Immunostaining of organoid sections’) with the only difference being 48 h of primary antibody incubation at 4 °C. Whole-mount stained organoids were transferred to 1× PBS in a glass-bottom 96-well plate (Cellvis P96-1.5H-N) and imaged using an Olympus Fluoview FV3000 microscope.After whole-mount imaging, tissue clearing was performed by incubating the organoids in 50% CUBIC R+ (TCI America T3741-25ML) for 24 h, then transferring the organoids to 100% CUBIC R+ for at least 48 h. Organoids were then re-imaged as described above.Western blottingCortical organoids were harvested in lysis buffer containing 1% SDS in 1× PBS with Halt phosphatase inhibitor cocktail (Thermo Fisher, PI78420) and Complete mini EDTA-free protease inhibitor cocktail (Roche, 4693159001). Immunopanned astrocytes were harvested immediately after immunopanning with 100 μl of lysis buffer (lysis buffer: 10 mM Na-PPi (Sigma, 221368), 10 mM Na-beta-glycerophosphate (Sigma, G5422), 40 mM HEPES, 4 mM EDTA (Sigma, E5134), 1% Triton X-100 (Sigma, T8787), phosphatase inhibitor and protease inhibitor in 1× PBS adjusting pH to 7.4). Total protein was determined by bicinchoninic acid assay (Thermo Fisher, PI23227) and 4 μg (whole-organoid samples) or 8–10 μg (immunopanned astrocyte samples) of protein in 1× Laemmli sample buffer (Bio-Rad, 161-0747) were loaded onto 4–15% Criterion TGX gels (Bio-Rad, 5671084). Proteins were transferred overnight at low voltage to polyvinyl difluoride membranes (Bio-Rad, 1620177), blocked in 5% milk in 1× Tris-buffered saline with Tween (TBS-Tween) for 1 h at room temperature and incubated with primary antibodies diluted in 5% milk in 1× TBS-Tween overnight at 4 °C. The following day, membranes were washed 3 × 10 min in 1× TBS-Tween and incubated with HRP-conjugated secondary antibodies (1:5,000) for 1 h at room temperature, washed 6 times for 10 min in 1× TBS-Tween, incubated with chemiluminescence substrate (Revvity Health Sciences, NEL105001EA) and developed on GE Amersham Hyperfilm ECL (VWR, 95017-661) or imaged using a ChemiDoc (Bio-Rad). Membranes were stripped by two 6-min incubations in stripping buffer (6 M guanidine hydrochloride (Fisher Scientific, ICN10190505) with 1:150 β-mercaptoethanol) with shaking followed by 4 2-min washes in 1× TBS with 0.05% NP-40 to reblot on subsequent days.Bands were quantified by densitometry using ImageJ v.1.52p software (NIH). For all experiments, phospho-proteins were normalized to their respective total proteins. β-actin was used as a loading control for the whole-organoid samples. Antibody vendors, catalogue numbers and dilutions are listed in Supplementary Table 13. All antibodies were used in accordance with manufacturer guidelines and were validated by the manufacturer for use in human samples for the specific assays used in this study.ImmunopanningImmunopanning47 was performed on non-treated six-well plates (Corning, 3736). The day before the experiment, each well was incubated overnight at 4 °C with 1:400 goat anti-mouse IgG + IgM antibody (Jackson ImmunoResearch, 115-005-044) in 50 mM Tris-HCl pH 9.5 (Thermo Fisher, J62084.K2). Plates for plating cells were prepared by coating Corning BioCoat Poly-d-Lysine 24-well plates (Corning, 356414) with laminin (Sigma, 11243217001) diluted 1:20 in 1× PBS at 37 °C overnight.On the day of immunopanning, panning plates were rinsed 3 times with 1× PBS, then incubated at room temperature with 1:1,000 anti-HepaCAM antibody (R&D systems, MAB4108, resuspended at 500 μg ml−1) in 1 ml of 1× PBS. Plates were incubated until use (roughly 2 h). Between 6 and 15 organoids (immunofluorescence experiments) or 2–4 organoids (western blotting experiments) were dissociated with the same dissociation media as for the FACS protocol listed above. Organoids were triturated and resuspended in 1 ml of room temperature 0.2% BSA (Sigma, A9418) in 1× PBS with 10 μM Y-27632. After dissociation, cells were filtered with a 70-µm pore size strainer (Greiner, 542170) to eliminate the clumps. The anti-HepaCAM plates were rinsed 4 times with 1× PBS and the cell suspension was added to the plates and incubated at room temperature for 20 min. After incubation, non-bound cells were washed off carefully three times with the BSA/PBS/Y27 solution.For the drug treatment and immunofluorescence experiments, the anti-HepaCAM plates with bound astrocytes were treated with 1 ml of accutase and incubated at 37 °C for 7 min to release the cells. The accutase was then inactivated with 1 ml of neural induction media (section ‘Organoid differentiation’) supplemented with BDNF and NT-3. Cells were dislodged using trituration and counted using a haemocytometer. The laminin was removed from the plating plates, the purified astrocyte suspension was added to the plate without rinsing, and cells were returned to the incubator for 1 h. After 1 h, a full media change was performed with neural induction media supplemented with BDNF and NT-3. Astrocytes were cultured in neural induction media for 7 days, fixed with 4% PFA for 15 min at room temperature and immunofluorescence was performed as described above.For acute western blotting experiments, instead of adding accutase, the immunopanned astrocytes were lysed directly from the anti-HepaCAM plates with lysis buffer and western blotting was carried out as described above.Rapamycin and Torin experimentsFor mTOR inhibitor experiments, astrocytes were immunopanned from day 315–355 organoids. After 24 h of recovery, cells were treated with DMSO at a 1:1,000 dilution, rapamycin (Cayman Chemicals, 13346) at a concentration of 50 nM, or Torin-1 (Tocris, 4247) at a concentration of 100 nM, with half media changes every other day. Cells were fixed with 4% PFA after 7 days of drug treatment.For 4i cyclic staining81,82, antibody staining was performed as described above, except that the sample well was filled with imaging buffer (freshly prepared 0.7 M N-acetyl-cysteine (Sigma, A7250) in 0.2 M phosphate buffer at pH 7.4). Samples were imaged using an Opera Phenix Plus High-Content Screening System (Revvity) using Revvity Harmony v.5.2, with a 20× water immersion objective. Antibody elution was performed immediately after imaging. Before elution, TCEP-HCl (Sigma, C4706) was added to a stock solution (0.5 M glycine (Fisher, BP381-1), 3 M urea (Fisher, U15) and 3 M guanidine hydrochloride (MP Biomedicals, 101905), stored at 4 °C) to a final concentration of 0.07 M (20 mg ml−1). To elute antibodies, samples were rinsed with 1× PBS, incubated for 5 min with elution buffer and rinsed with water. This process was repeated for a total of three washes. After elution, samples were washed with 1× PBS, stained with Hoechst and selected regions were re-imaged to ensure that elution was successful. Antibodies and cycles were excluded from the analysis if residual signal was still present.Bulk RNA-seqFor bulk RNA-seq, each organoid was transferred to a 1.5-ml tube, residual media was removed and samples were snap-frozen in liquid nitrogen. RNA was extracted using the RNeasy Mini kit (Qiagen, 74104) according to the manufacturer’s instructions. Library preparation and sequencing was performed by the QB3-Berkeley Genomics core laboratories. Total RNA quality as well as poly-dT enriched mRNA quality were assessed on an Agilent 2100 Bioanalyzer. Libraries were prepared using the KAPA mRNA Hyper Prep kit (Roche, KK858). Truncated universal stub adapters were ligated to complementary DNA fragments, which were then extended through nine cycles of PCR using unique dual indexing primers into full length Illumina adapters. Library quality was checked on an AATI Fragment Analyzer. Library molarity was measured by use of quantitative PCR with the KAPA Library Quantification Kit (Roche, KK4824) on a Bio-Rad CFX Connect thermal cycler. Libraries were then pooled by molarity and sequenced on an Illumina NovaSeq X with the 25B flowcell for 2 × 150 cycles, targeting at least 25 M reads per sample. Fastq files were generated and demultiplexed using Illumina BCL Convert v.4 and default settings. Transcript alignment was performed using Kallisto v.0.48.0 (ref. 83), and statistical analysis was performed using DESeq2 v.1.46.0 (ref. 84).Cytokine release assayTo assess cytokine release from organoids, three organoids per hiPS cell line and genotype were transferred to a 1.5-ml tube with 500 µl of Neurobasal/B27 culture medium. Organoids were incubated in standard incubator conditions (37 °C at 5% CO2) for 48 h. The media was removed to a fresh tube and centrifuged at 300g for 5 min and the supernatant was stored at −80 °C. Cytokine concentrations were measured using the R&D Systems Proteome Profiler Human XL Cytokine Array Kit (R&D ARY022B) according to the manufacturer’s protocol, using 300 µl of culture supernatant as input. Membranes were developed on GE Amersham Hyperfilm ECL (VWR, 95017-661).Immunostaining of human cortical tuber sectionsSurgically resected cortical tuber tissue was collected under Stanford University Institutional Review Board protocol IRB-12625 (‘The Neuroscience Brain Bank: Collection of Neurosurgical Tissue for Research’). Patients were recruited on the basis of clinical criteria, including a diagnosis of TSC and medically intractable seizures. Informed consent was obtained from the caregivers and legal guardians of all participants. After surgical resection, samples were placed into Eppendorf tubes and frozen and stored at −80 °C. Portions of samples were cut and embedded in OCT. OCT sample blocks were cryosectioned (Leica, CM3050S) to create 18-μm sections.For standard immunohistochemistry, cryosectioned samples were fixed with 4% PFA in 1× PBS for 10 min and then washed 3 times in 1× PBS. Sections were blocked in buffer containing 10% normal donkey serum (Jackson ImmunoResearch, 017-000-121), and 0.3% Triton X-100 in 1× PBS for 1 h at room temperature. Sections were then incubated overnight at 4 °C with primary antibodies in antibody dilution buffer (10% normal donkey serum in 1× PBS). The following day, sections were washed 3 times with 1× PBS, incubated in secondary antibody (1:500 in antibody dilution buffer) and Hoechst stain (1:1,000) for 1 h at room temperature and washed 3 times with 1× PBS. Slides were coverslipped with ProLong Glass Antifade Mountant and allowed to set for at least 1 day before imaging. Antibody vendors, catalogue numbers and dilutions are listed in Supplementary Table 13.For cyclic imaging, a well was created by cutting a rectangular shape from a sheet of cured polydimethylsiloxane (Dow, Sylgard 184) and pressed to the glass slide with cryosectioned samples. Antibody staining was performed as described above, except that the sample well was filled with an imaging buffer (freshly prepared 0.7 M N-acetyl-cysteine (Sigma, A7250) in 0.2 M phosphate buffer at pH 7.4) instead of mounting media81,82, and imaging of the full tuber section was performed through the bottom glass slide. Confocal images were acquired using a ×10 objective and 4,096 × 4,096 pixel resolution on an Olympus Fluoview FV3000 microscope. Antibody elution was performed immediately after imaging. Before elution, TCEP-HCl (Sigma, C4706) was added to a stock solution (0.5 M glycine (Fisher, BP381-1), 3 M urea (Fisher, U15) and 3 M guanidine hydrochloride (MP Biomedicals, 101905), stored at 4 °C) to a final concentration of 0.07 M (20 mg ml−1). To elute antibodies, samples were rinsed with 1× PBS, incubated for 5 min with elution buffer and rinsed with water. This process was repeated for a total of three washes. After elution, samples were washed with 1× PBS, stained with Hoechst and selected regions were re-imaged to ensure that elution was successful (Extended Data Fig. 8b). Antibodies and cycles were excluded from analysis if residual signal was excessive. The blocking step for the next round of antibody staining was started immediately afterwards. Eluted samples were stored in the dark at 4 °C in 1× PBS for up to 48 h between cycles, and stained samples containing fluorescent antibodies were stored in the dark at 4 °C in imaging buffer for up to 24 h.Cyclic staining analysisImages from each cycle were stitched and aligned on the Hoechst channel using a developmental branch of the Alignment by Simultaneous Harmonization of Layer/Adjacency Registration (ASHLAR) software package containing a rotation correction85,86. Standard intensity-based image analysis was performed as described above, using manually chosen p-S6 intensity thresholds.The image UMAP process is described in Extended Data Fig. 8a. Beginning with the ASHLAR-aligned image channels, Stardist was used to segment nuclei for each cycle individually. Because ASHLAR alignment results in the same coordinate system for all channels, each nucleus label in the first channel was matched to the nearest label in each subsequent channel to identify the same cell across channels. Poor matches were filtered by a defined maximum allowable distance between any pair of label centroids across channels. After identifying confidently aligned cells, intensity data for each cell were extracted. All pixels within a 30 pixels (9.3 μm for tubers) or 50 pixels (14.8 μm for immunopanned astrocytes) radius circle centred on each cell’s label centroid across all cycles were extracted. These data were then reshaped into a one-dimensional vector, and data from all cells were stacked to generate a 2D matrix of (cell index) × (pixel intensity). The UMAP-learn package was used to perform dimensionality reduction on this matrix, and HDBSCAN was used on the UMAP embeddings to determine clustering. For differential intensity measurements, intensity data, cluster assignments and UMAP embeddings were used to generate a Seurat object, and differential intensity was calculated using the Wilcoxon rank-sum test with the Bonferroni correction.For the mTOR inhibitor experiments in Extended Data Fig. 9, images were acquired using an Opera Phenix Plus High-Content Screening System (Revvity) using Revvity Harmony v.5.2. The image UMAP was computed on a subset of the full dataset in which the numbers of cells from each genotype and treatment combination were equalized. The full dataset was then projected into the embedding derived from the balanced subset.Reporting summaryFurther information on research design is available in the Nature Portfolio Reporting Summary linked to this article.